Fig. 13
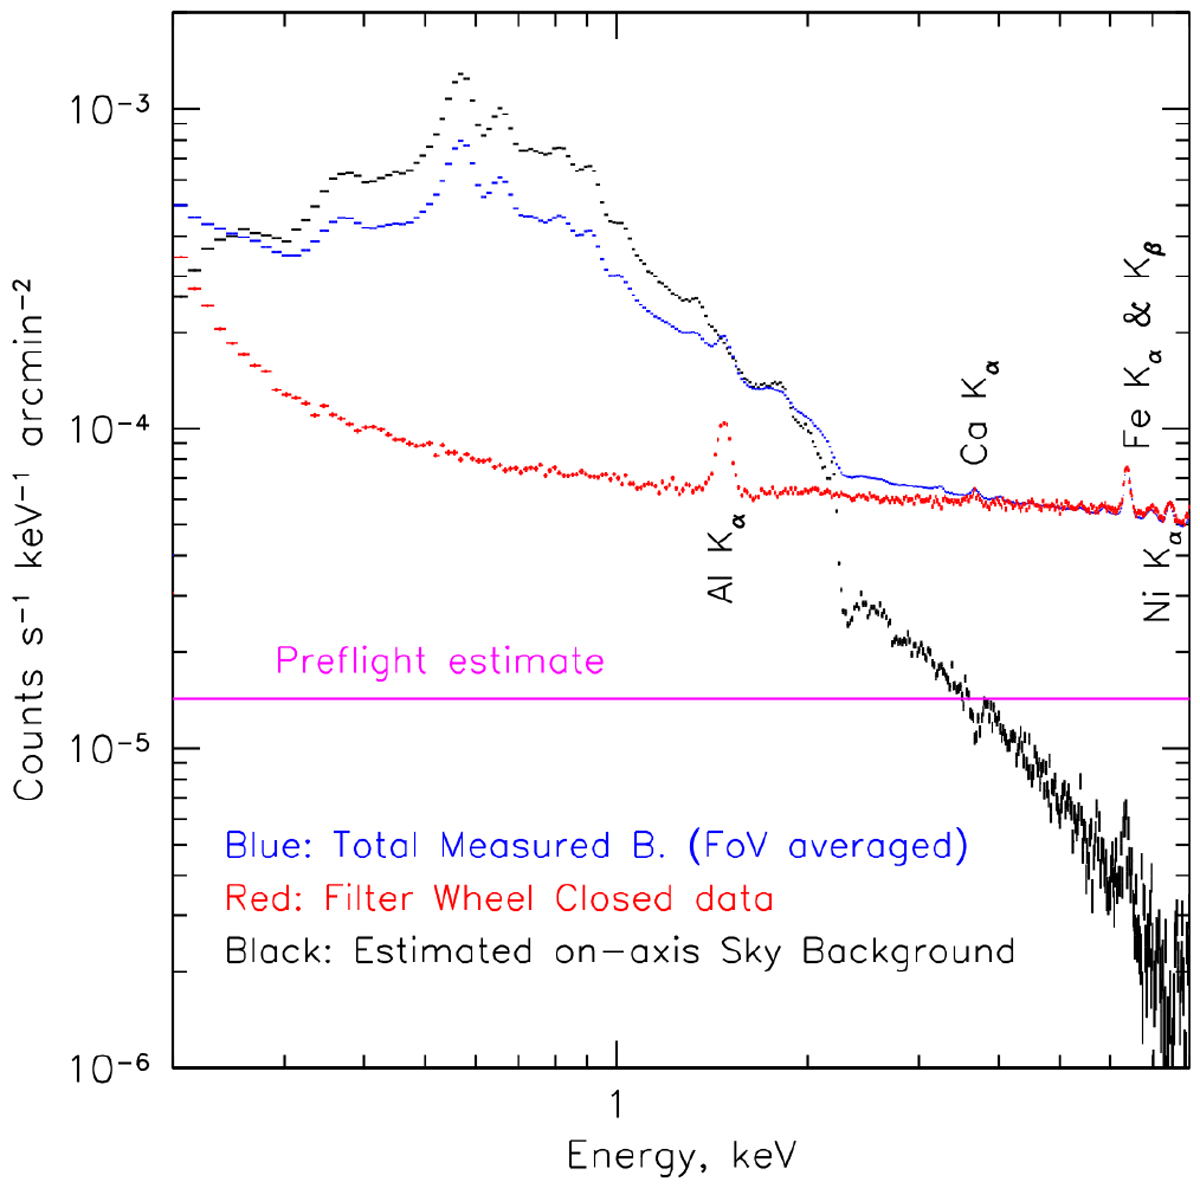
Stacked eROSITA all-sky survey background spectrum (per individual telescope). The blue points are the total measured background. The red points show the background measured during filter wheel closed observations (see Fig. 12). The indicated spectral lines are of instrumental origin (see text). The black points mark the reconstructed (i.e., corrected for vignetting) on-axis photon background spectrum. The horizontal magenta line is the approximate expected particle background level estimated pre-launch (Tenzer et al. 2010).
Current usage metrics show cumulative count of Article Views (full-text article views including HTML views, PDF and ePub downloads, according to the available data) and Abstracts Views on Vision4Press platform.
Data correspond to usage on the plateform after 2015. The current usage metrics is available 48-96 hours after online publication and is updated daily on week days.
Initial download of the metrics may take a while.