Fig. 10
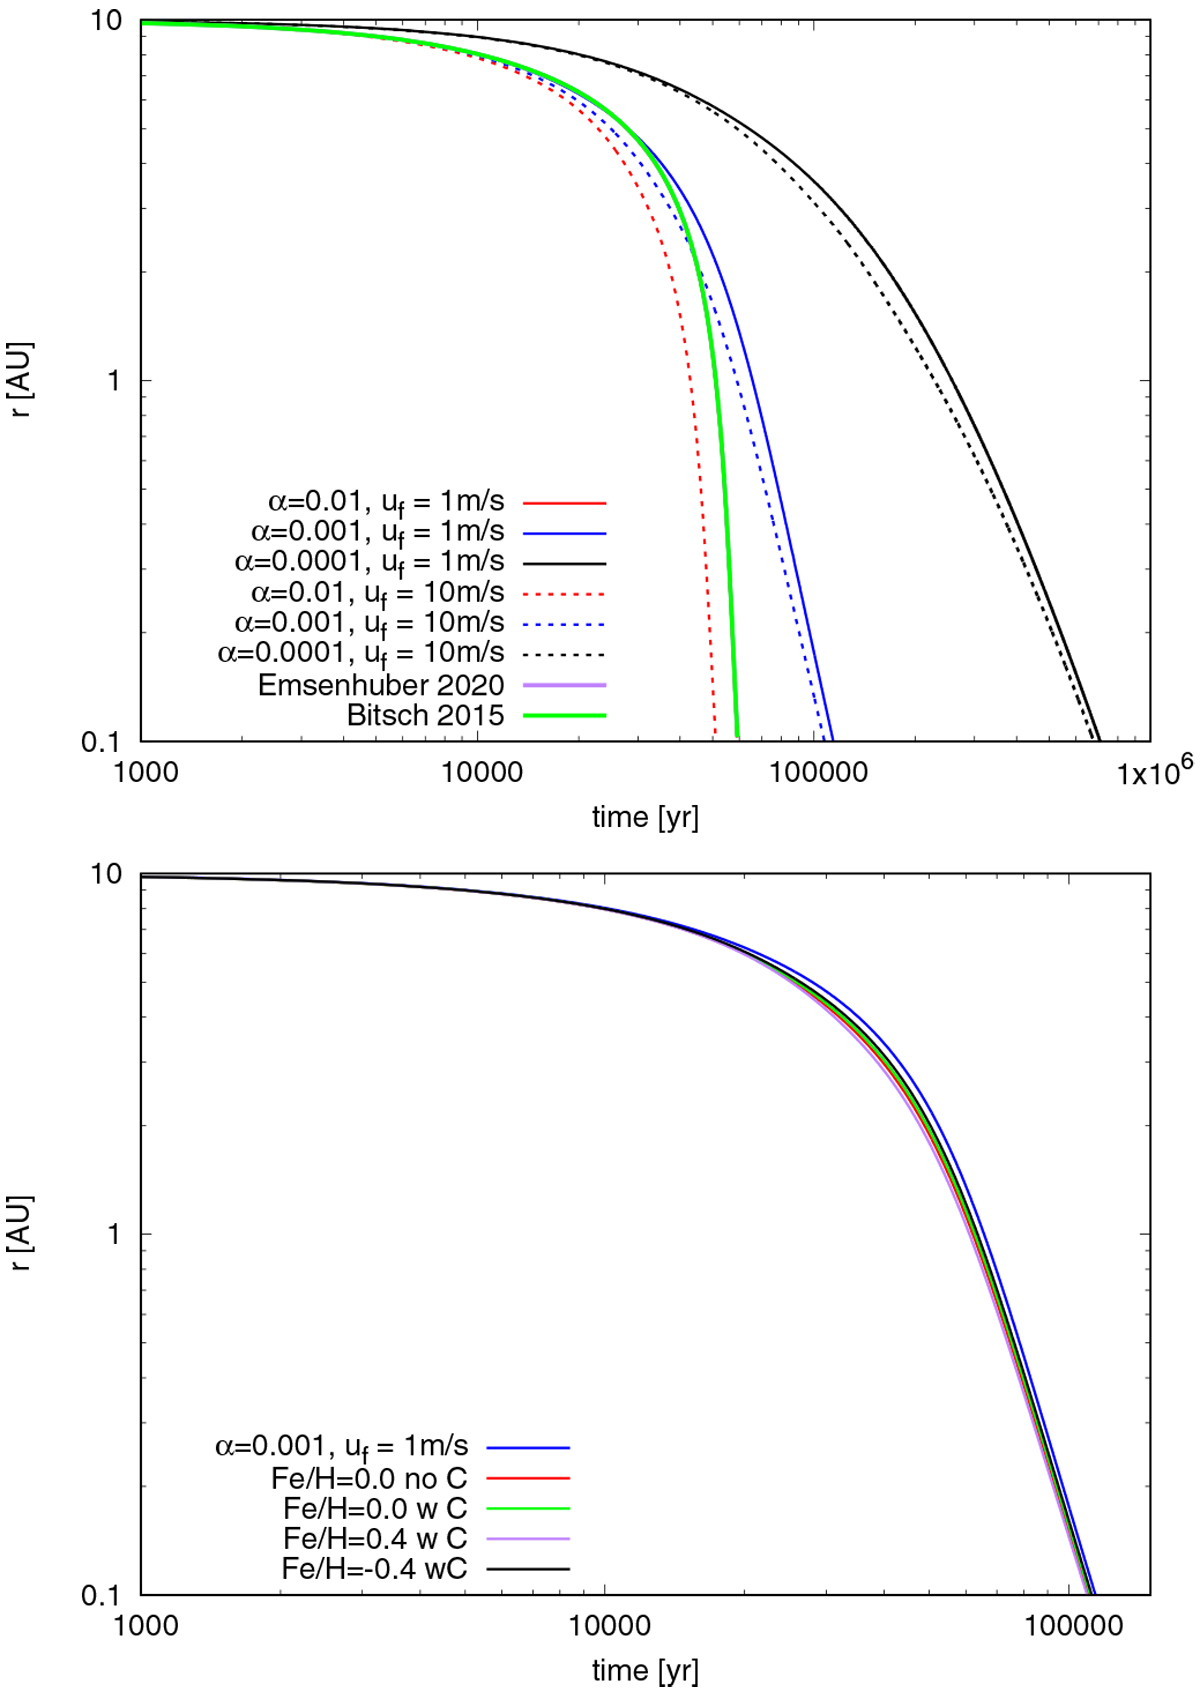
Change of semi-major axis as a function of time for a planet with a constant mass of 20 Earth masses embedded in our disc model at initially 10 AU for different prescriptions of α (top) and for different chemical compositions for the opacity (bottom). All simulations in the bottom plot feature α = 0.001 and uf = 1 m s−1. The two opacity descriptions using Bitsch et al. (2015a) and Emsenhuber et al. (2020) for the envelope opacity use pure micrometer grain opacities for migration, resulting in identical migration patterns.
Current usage metrics show cumulative count of Article Views (full-text article views including HTML views, PDF and ePub downloads, according to the available data) and Abstracts Views on Vision4Press platform.
Data correspond to usage on the plateform after 2015. The current usage metrics is available 48-96 hours after online publication and is updated daily on week days.
Initial download of the metrics may take a while.