Free Access
Fig. 9
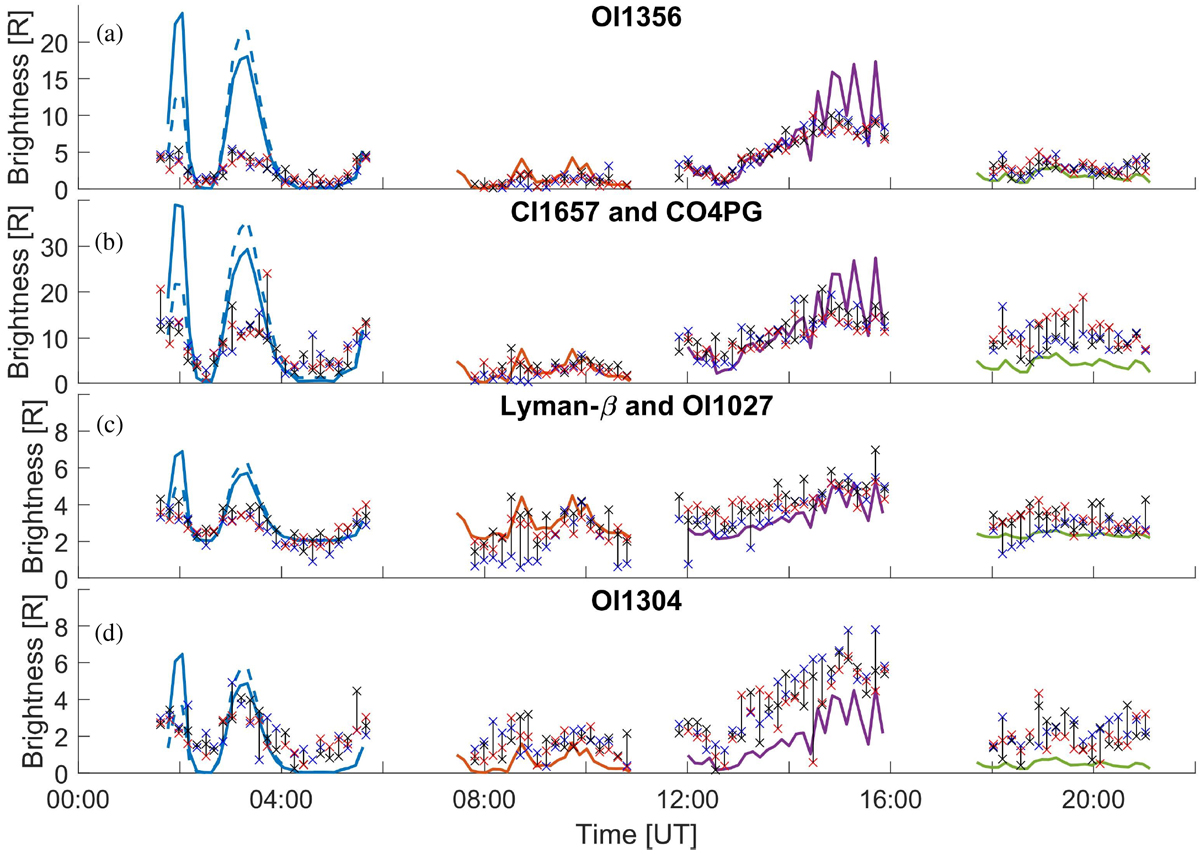
Comparison of the observed and modelled brightness of the OI1356 (a) and CI1657 (b) emission lines from 9 July 15:00 UT to 11 July 00:00 UT 2016. The plots follow the same format as outlined in Fig. 7. The modelled brightnesses shown here are only driven by electron impact on CO2.
Current usage metrics show cumulative count of Article Views (full-text article views including HTML views, PDF and ePub downloads, according to the available data) and Abstracts Views on Vision4Press platform.
Data correspond to usage on the plateform after 2015. The current usage metrics is available 48-96 hours after online publication and is updated daily on week days.
Initial download of the metrics may take a while.