Fig. 3
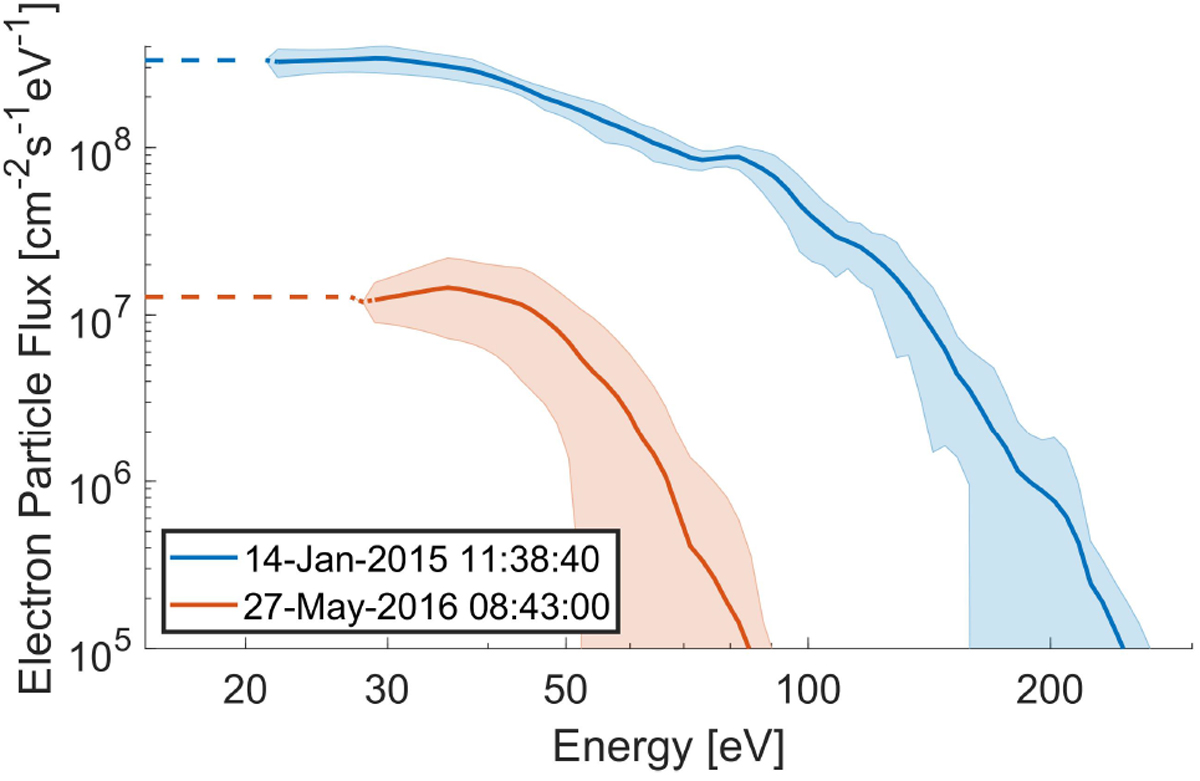
Suprathermal electron particle flux during two nadir Alice scans during quiet periods. The solid line is the average particle flux during each of the scans, while the shaded region corresponds to the standard deviation of the electron flux in the same period. The extrapolation of the electron flux to energies below which RPC/IES could not measure, due to the spacecraft potential, is given by the dashed line.
Current usage metrics show cumulative count of Article Views (full-text article views including HTML views, PDF and ePub downloads, according to the available data) and Abstracts Views on Vision4Press platform.
Data correspond to usage on the plateform after 2015. The current usage metrics is available 48-96 hours after online publication and is updated daily on week days.
Initial download of the metrics may take a while.