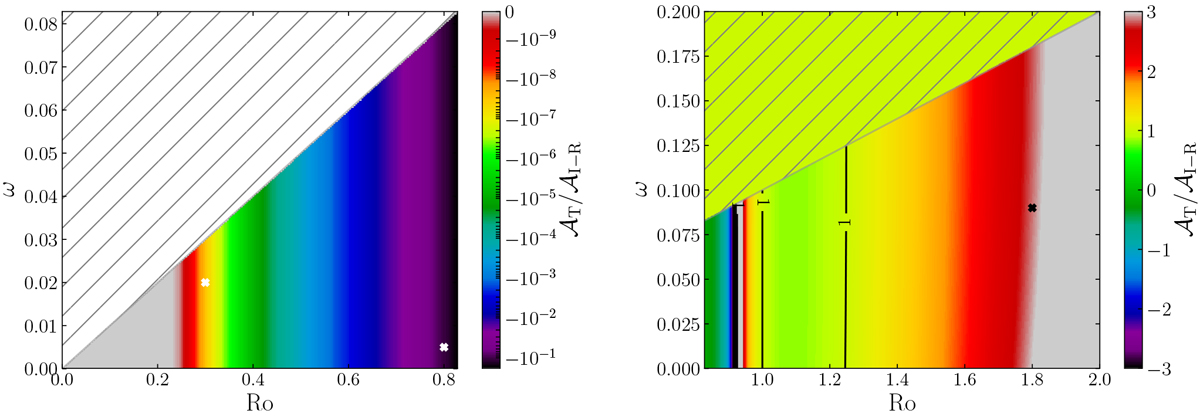
Fig. 8

Ratio of the wave action flux above and below the critical level against the Rossby number and the inertial frequency for R >1∕4 (left panel) and R < 1∕4 (right panel) when the box is at the pole. As in Fig. 7, kx = kz = 0.1 and hatchedzones represent areas without critical levels. Again, crosses indicate the set of parameters chosen to analyse the behaviour of the velocity in the three-layer model.
Current usage metrics show cumulative count of Article Views (full-text article views including HTML views, PDF and ePub downloads, according to the available data) and Abstracts Views on Vision4Press platform.
Data correspond to usage on the plateform after 2015. The current usage metrics is available 48-96 hours after online publication and is updated daily on week days.
Initial download of the metrics may take a while.


