Fig. 6
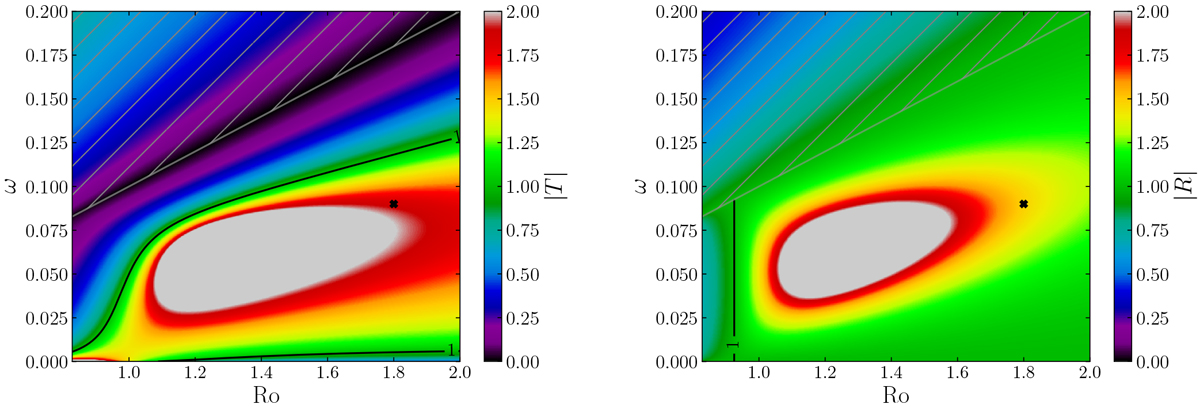
Transmission coefficient (|T|, left panel) and reflection coefficient (|R|, right panel) when the box is at the pole. The coefficients are plotted in the regime R < 1∕4 (a possibly unstable case, see Sect. 3.4.4) as a function of the Rossby number Ro and the inertial frequency ω. The hatched areas do not feature critical points and correspond to regions where ω > kx Ro in our peculiar geometry (see Appendix D.2 for this particular matter). Vertical and longitudinal wave numbers are fixed: kx = 0.1 and kz = 0.1. Moreover, the contours that correspond to coefficients |R| and |T| that are equal to one are indicated by solid black lines. Crosses mark the set of parameters used in Fig. 9for the analysis of the behaviour of the velocity in the three-layer model.
Current usage metrics show cumulative count of Article Views (full-text article views including HTML views, PDF and ePub downloads, according to the available data) and Abstracts Views on Vision4Press platform.
Data correspond to usage on the plateform after 2015. The current usage metrics is available 48-96 hours after online publication and is updated daily on week days.
Initial download of the metrics may take a while.