Fig. 3
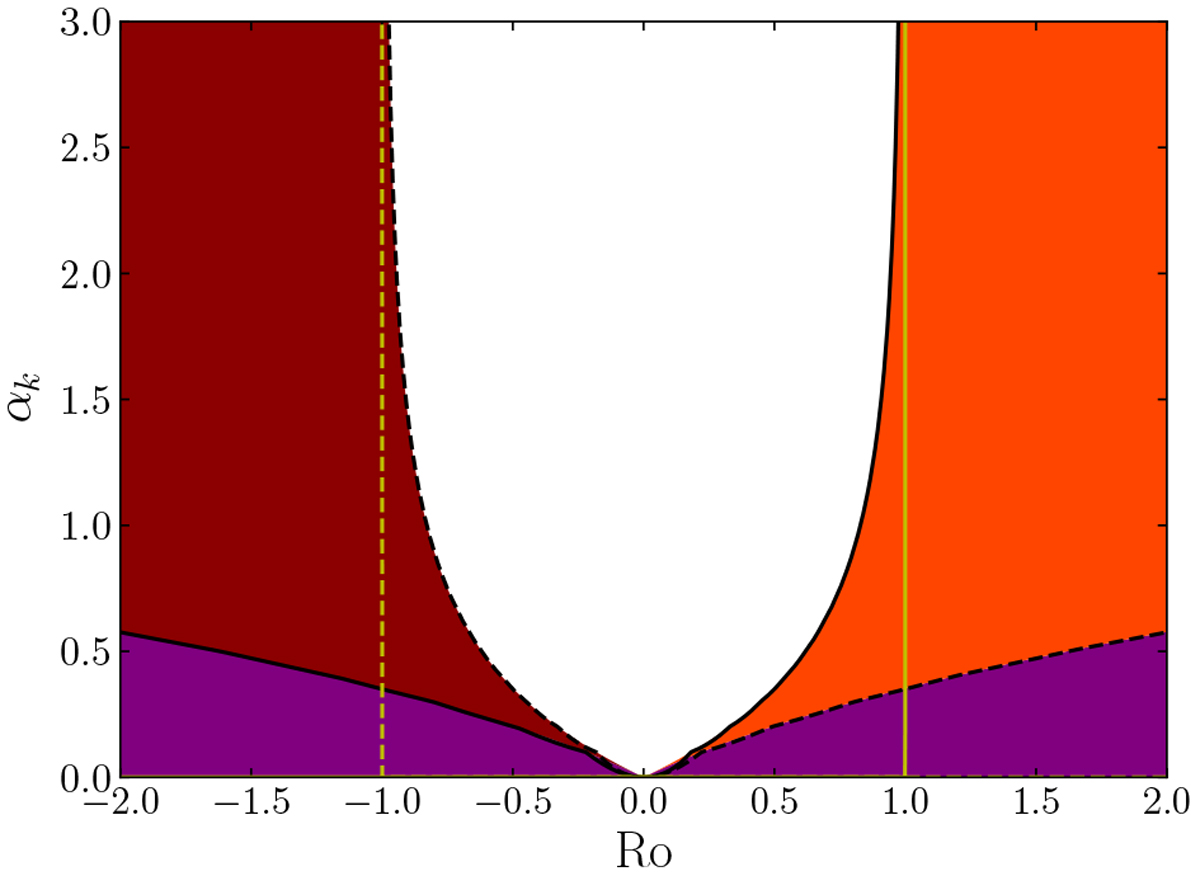
Diagram showing how ![]() compares to 1∕4 for two positions of the box (θ0 = 0 and π), as well as for a range of Rossby numbers Ro
and a range of the vertical to longitudinal wavenumber ratio αk. The solid and dashed black lines mark where
compares to 1∕4 for two positions of the box (θ0 = 0 and π), as well as for a range of Rossby numbers Ro
and a range of the vertical to longitudinal wavenumber ratio αk. The solid and dashed black lines mark where ![]() at the north and south poles, respectively. The purple domain shows where
at the north and south poles, respectively. The purple domain shows where
![]() , and the white region where
, and the white region where ![]() , regardless of whether the box is at the north or the south pole. In the dark red region,
, regardless of whether the box is at the north or the south pole. In the dark red region,
![]() and
and ![]() and vice versa in the orange region.
and vice versa in the orange region.
Current usage metrics show cumulative count of Article Views (full-text article views including HTML views, PDF and ePub downloads, according to the available data) and Abstracts Views on Vision4Press platform.
Data correspond to usage on the plateform after 2015. The current usage metrics is available 48-96 hours after online publication and is updated daily on week days.
Initial download of the metrics may take a while.