Fig. 6.
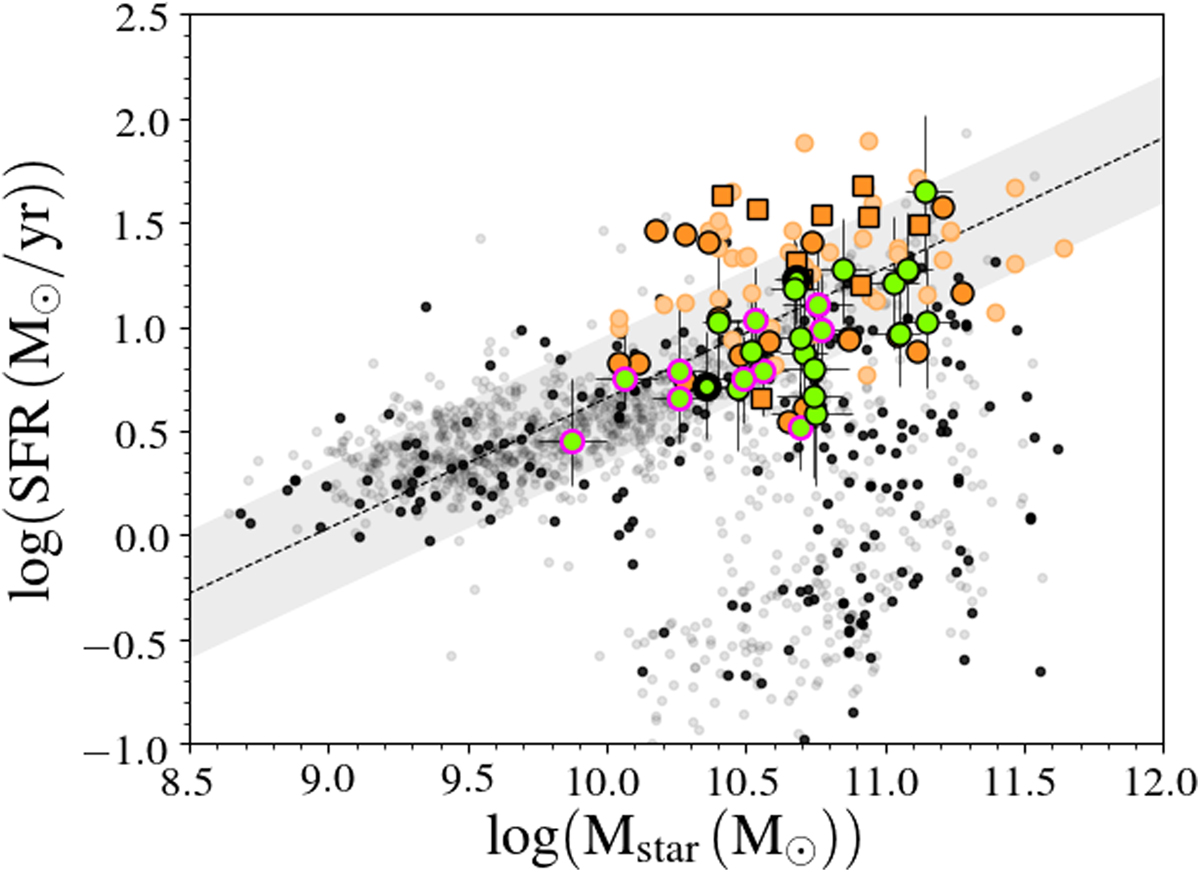
Location of the CL1411 (grey) and ALMA (green) galaxies in the stellar mass–SFR plane. The dots with thick black borders represent the Spitzer-observed galaxies and those with the pink outline indicate the low-μH2 galaxies. Galaxies in black and grey are the rest of the spectroscopic and photometric samples, respectively, at the cluster redshift. The plain orange circles are the PHIBSS2 galaxies with 0.49 ≤ z ≤ 0.6, while the light orange circles trace the PHIBSS2 sample at 0.6 < z ≤ 0.8; the orange squares show the cluster LIRGs of Castignani et al. (2020) at z ∼ 0.54. The dashed black line is the Speagle et al. (2014) MS corrected for a Chabrier IMF, at our cluster redshift with the corresponding ±0.3 dex scatter as the grey shaded area.
Current usage metrics show cumulative count of Article Views (full-text article views including HTML views, PDF and ePub downloads, according to the available data) and Abstracts Views on Vision4Press platform.
Data correspond to usage on the plateform after 2015. The current usage metrics is available 48-96 hours after online publication and is updated daily on week days.
Initial download of the metrics may take a while.