Fig. 3.
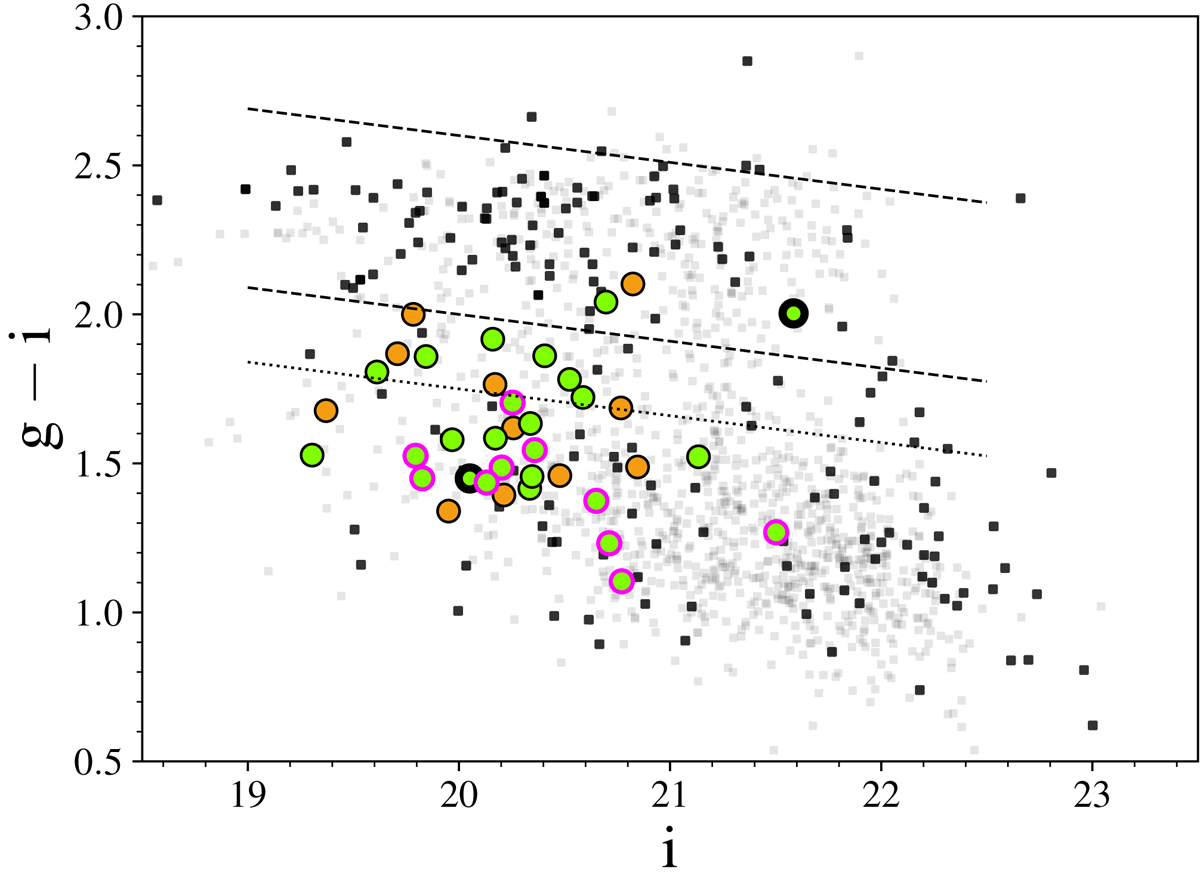
Observed colour–magnitude diagram, g − i as a function of i for the CL1411 galaxies. Our ALMA sample is in green. The dots with the thick black borders are our Spitzer-observed galaxies, and those with the pink borders are our low-μH2 sample (see Sect. 4.3). The orange dots are the PHIBSS2 galaxies. The grey points are the photometric redshift members. The small black dots are the spectroscopic redshift galaxies, within 3σcl of the cluster redshift. The dashed lines delimit the red sequence and its ±0.3 mag dispersion. The dotted line delimits the transition zone between the blue clump and the red sequence, 0.25 mag below the lower boundary of the red sequence.
Current usage metrics show cumulative count of Article Views (full-text article views including HTML views, PDF and ePub downloads, according to the available data) and Abstracts Views on Vision4Press platform.
Data correspond to usage on the plateform after 2015. The current usage metrics is available 48-96 hours after online publication and is updated daily on week days.
Initial download of the metrics may take a while.