Fig. 2.
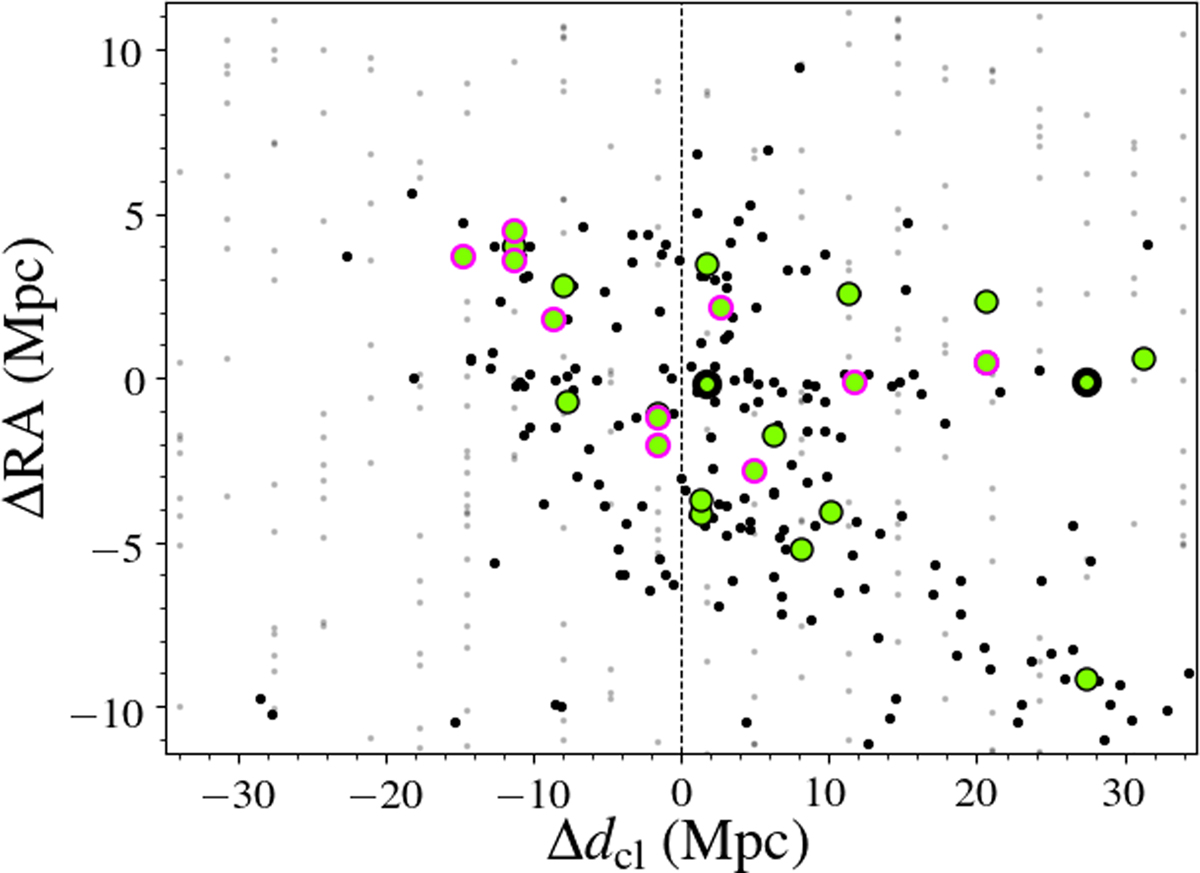
Light cone centred on zcl = 0.5195 and extending to ±3σcl in redshift. In right ascension, 1° is covered. The vertical line corresponds to the cluster redshift. The grey points indicate the galaxies with a photometric redshift. Galaxies with spectroscopic redshifts are in black. Our sample is in green, lower μH2 galaxies (see Sect. 4.2) are outlined in pink, and Spitzer observed galaxies are outlined in thick black. Distances are expressed relative to the brightest cluster galaxy (BCG).
Current usage metrics show cumulative count of Article Views (full-text article views including HTML views, PDF and ePub downloads, according to the available data) and Abstracts Views on Vision4Press platform.
Data correspond to usage on the plateform after 2015. The current usage metrics is available 48-96 hours after online publication and is updated daily on week days.
Initial download of the metrics may take a while.