Fig. 1.
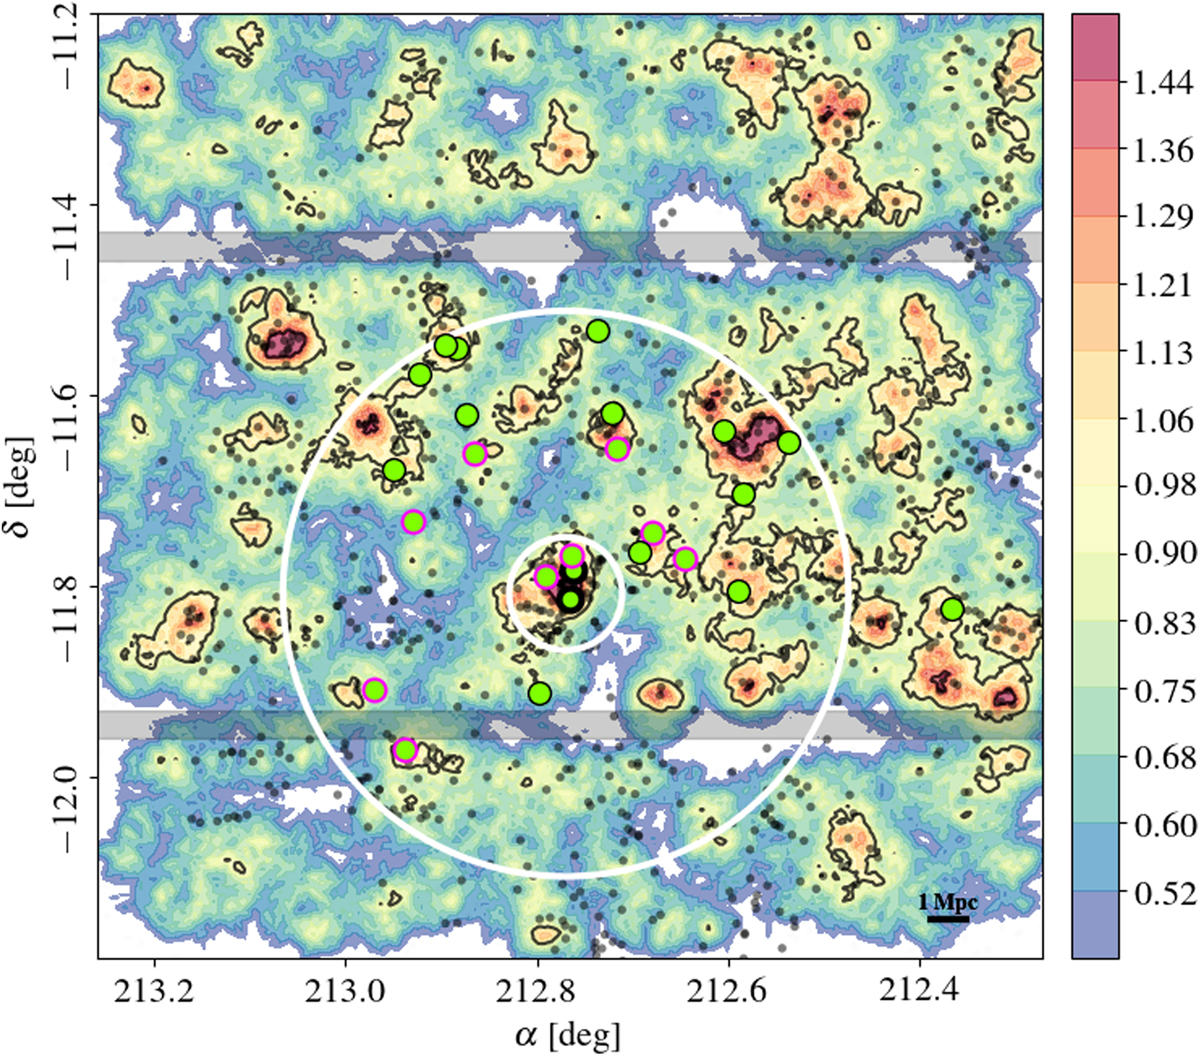
Density map of the CFHT/MEGACAM 1° × 1° field around CL1411.1−1148. The colour-coding indicates the log10 of the density of galaxies averaged over the ten nearest neighbours. Black contours are at 1 and 3σ above the field mean density. The grey points identify all galaxies with a zspec within 5σcl of the cluster redshift. The inner and outer white circles are positioned at R200 and 5R200 radius, respectively. The grey bands indicate the gaps between the MEGACAM CCDs. The green circles show our ALMA targets. The thick black outline identifies the two cluster members detected at 24 μm by Spitzer. The pink outer rings show the position of the galaxies with low gas fraction (see Fig. 9 and Sect. 4.2).
Current usage metrics show cumulative count of Article Views (full-text article views including HTML views, PDF and ePub downloads, according to the available data) and Abstracts Views on Vision4Press platform.
Data correspond to usage on the plateform after 2015. The current usage metrics is available 48-96 hours after online publication and is updated daily on week days.
Initial download of the metrics may take a while.