Fig. 9.
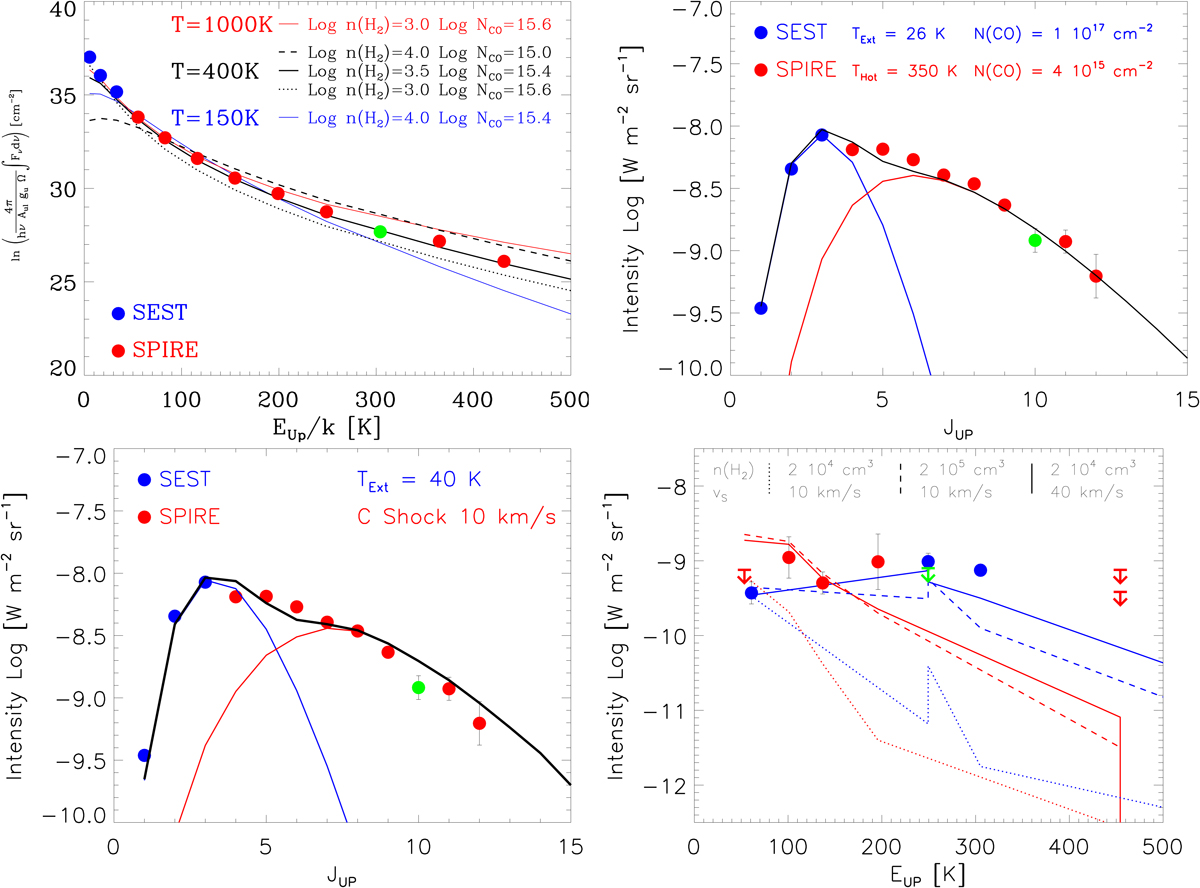
Upper left: rotation diagram for the CO lines. Blue dots: SEST observations from the literature, red dots: SPIRE data, green dot: SPIRE CO line blended with a water line. The full, dashed, and dotted lines show different single temperature RADEX models. Upper right: two temperature (RADEX) fits to the CO lines. One extended cold component (blue) with n(H2) = 7 × 103 cm−3 and N(CO) = 1 × 1017 cm−2, and one hot component (red) from more compact regions n(H2) = 104 cm−3 and N(CO) = 4 × 1015 cm−2. Lower left: a model consisting of a slightly warmer extended component with RADEX values of n(H2) = 7 × 103 cm−3 and N(CO) = 7 × 1016 cm−2 (blue), and a slow velocity C-type shock with a shock speed of 10 km s−1 and a pre-shock density of n(H + 2H2) = 2 × 104 cm−3 (red). The C-shock model comes from Flower & Pineau des Forêts (2010) where we have scaled their values to a 10″-source in order to obtain a best fit. Lower right: water lines modeling. Water emission lines observed by SPIRE – blue dots: o-H2O, green arrow: blended ortho-line, red dots: p-H2O. The same slow-velocity C-type shock as for CO but the model with a shock velocity of 10 km s−1 and a pre-shock density of n(H + 2H2) = 2 × 104 cm−3 underestimates the line intensities. Increasing the speed or the pre-shock density will give a better fit but it’s still hard to fit all para lines.
Current usage metrics show cumulative count of Article Views (full-text article views including HTML views, PDF and ePub downloads, according to the available data) and Abstracts Views on Vision4Press platform.
Data correspond to usage on the plateform after 2015. The current usage metrics is available 48-96 hours after online publication and is updated daily on week days.
Initial download of the metrics may take a while.