Fig. 8.
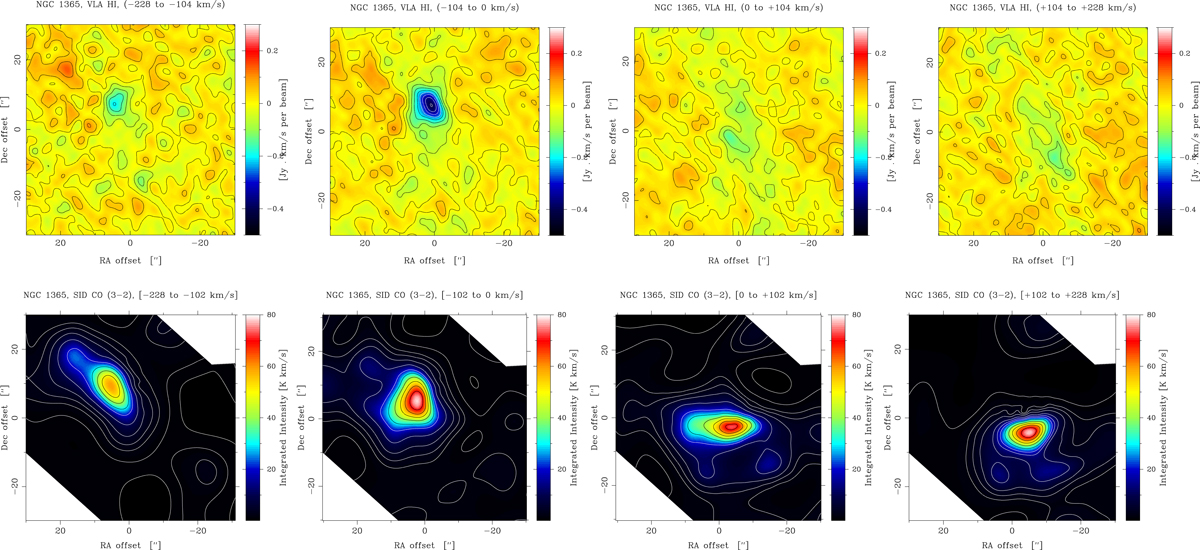
VLA H I (top) and SEST SID CO(3−2) (bottom) line intensity maps integrated over the velocity range indicated in the header [(−228 to −102), (−102 to 0), (0 to +102), (+102 to +228)] km s−1. The CO integrated intensity is antenna temperature – multiply by 3.8 to obtain main beam brightness temperature. The equatorial offsets are with respect to the optical nucleus. The velocity offsets are with respect to the systemic LSR velocity of 1613 km s−1.
Current usage metrics show cumulative count of Article Views (full-text article views including HTML views, PDF and ePub downloads, according to the available data) and Abstracts Views on Vision4Press platform.
Data correspond to usage on the plateform after 2015. The current usage metrics is available 48-96 hours after online publication and is updated daily on week days.
Initial download of the metrics may take a while.