Fig. 7.
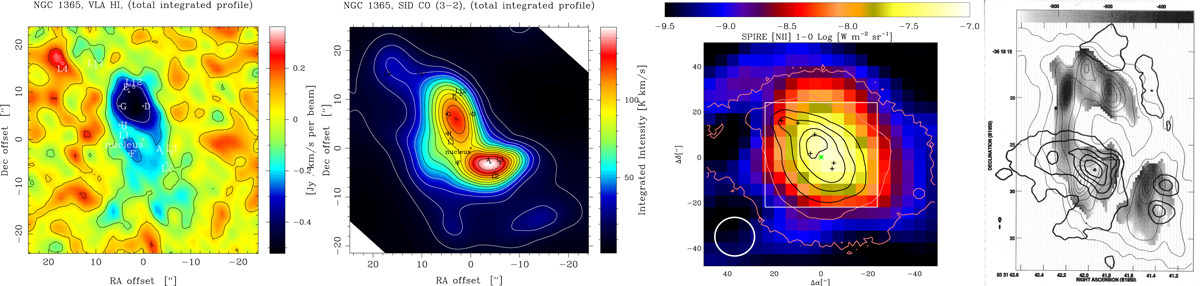
Panel number from the left: (1): VLA H I line total integrated intensity distribution, emission and absorption, is shown in the central region of NGC 1365. The circles are hot-spot H II regions and the squares are compact radio sources as defined in Table 2. The offsets are with respect to the optical nucleus, which is marked by a square. (2): SEST SID CO(3−2) total integrated line intensity (antenna temperature – multiply by 3.8 to obtain main beam brightness temperature). The equatorial offsets are with respect to the optical nucleus. (3): SPIRE map of 1461 GHz N II; the beam width is ≈17″. The white square marks the area covered in the H I and CO maps. Remaining features are as defined in Fig. 4. (4): O III emission line region (thick lines), and the VLA 20 cm radio continuum emission (thin lines) from the radio jet and the radio continuum circumnuclear ring. The gray scales, ranging from −0.3 (black) to −1.0 (white), indicate the 6/20 cm radio spectral index. The cross marks the position of the optical nucleus (from Sandqvist et al. 1995).
Current usage metrics show cumulative count of Article Views (full-text article views including HTML views, PDF and ePub downloads, according to the available data) and Abstracts Views on Vision4Press platform.
Data correspond to usage on the plateform after 2015. The current usage metrics is available 48-96 hours after online publication and is updated daily on week days.
Initial download of the metrics may take a while.