Fig. 4.
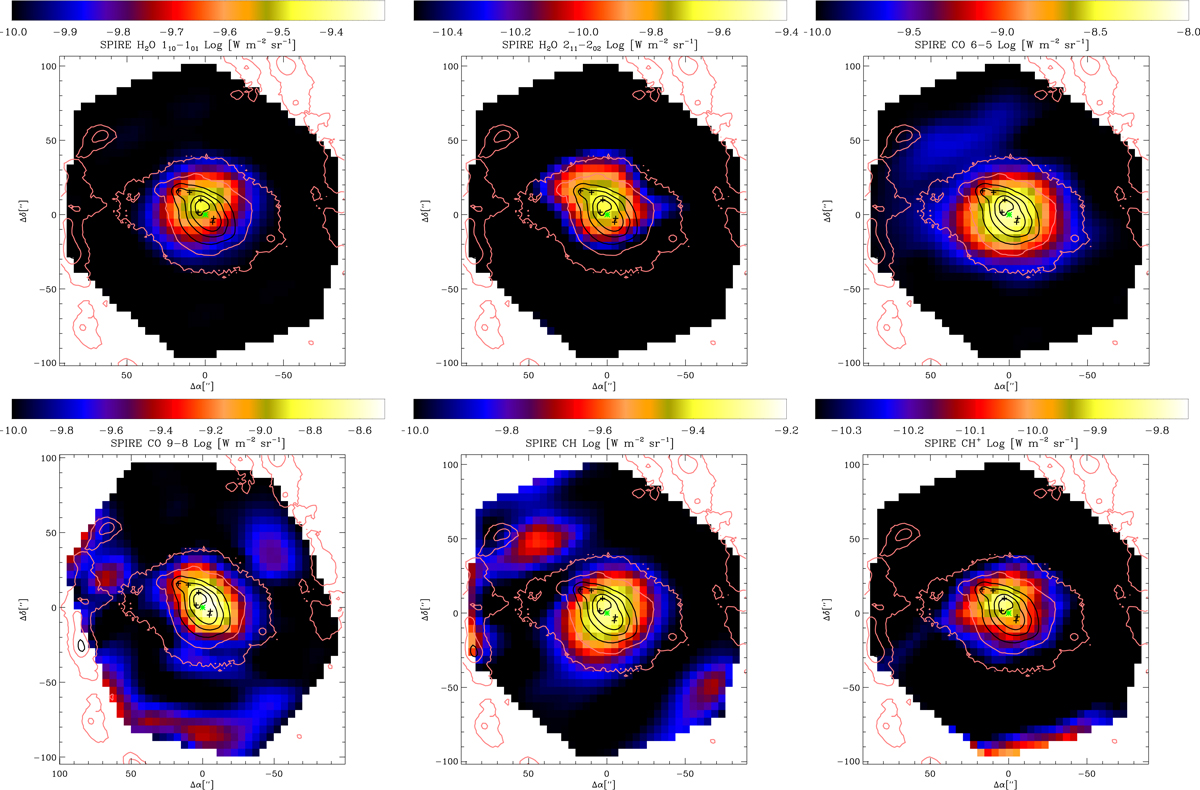
SPIRE maps of 557 GHz o-H2O (≈35″), 752 GHz p-H2O (≈35″), J = 6−5 CO (≈30″), J = 9−8 CO (≈20″), 537 GHz CH (≈35″), and 835 GHz CH+ (≈35″), the beamwidths are in parentheses. The contours are from the PACS 70 μm observations seen in Fig. 1 and reflect the distibution of warm dust, the maximum being near the NE torus component. The crosses, from top to bottom (in decreasing declination), represent the “hot spot” H II regions L4, L11, L12, L1, L3, and L2, the latter two being near the SW torus component. The equatorial offsets are with respect to the optical nucleus which is marked with a green asterisk.
Current usage metrics show cumulative count of Article Views (full-text article views including HTML views, PDF and ePub downloads, according to the available data) and Abstracts Views on Vision4Press platform.
Data correspond to usage on the plateform after 2015. The current usage metrics is available 48-96 hours after online publication and is updated daily on week days.
Initial download of the metrics may take a while.