Fig. 1.
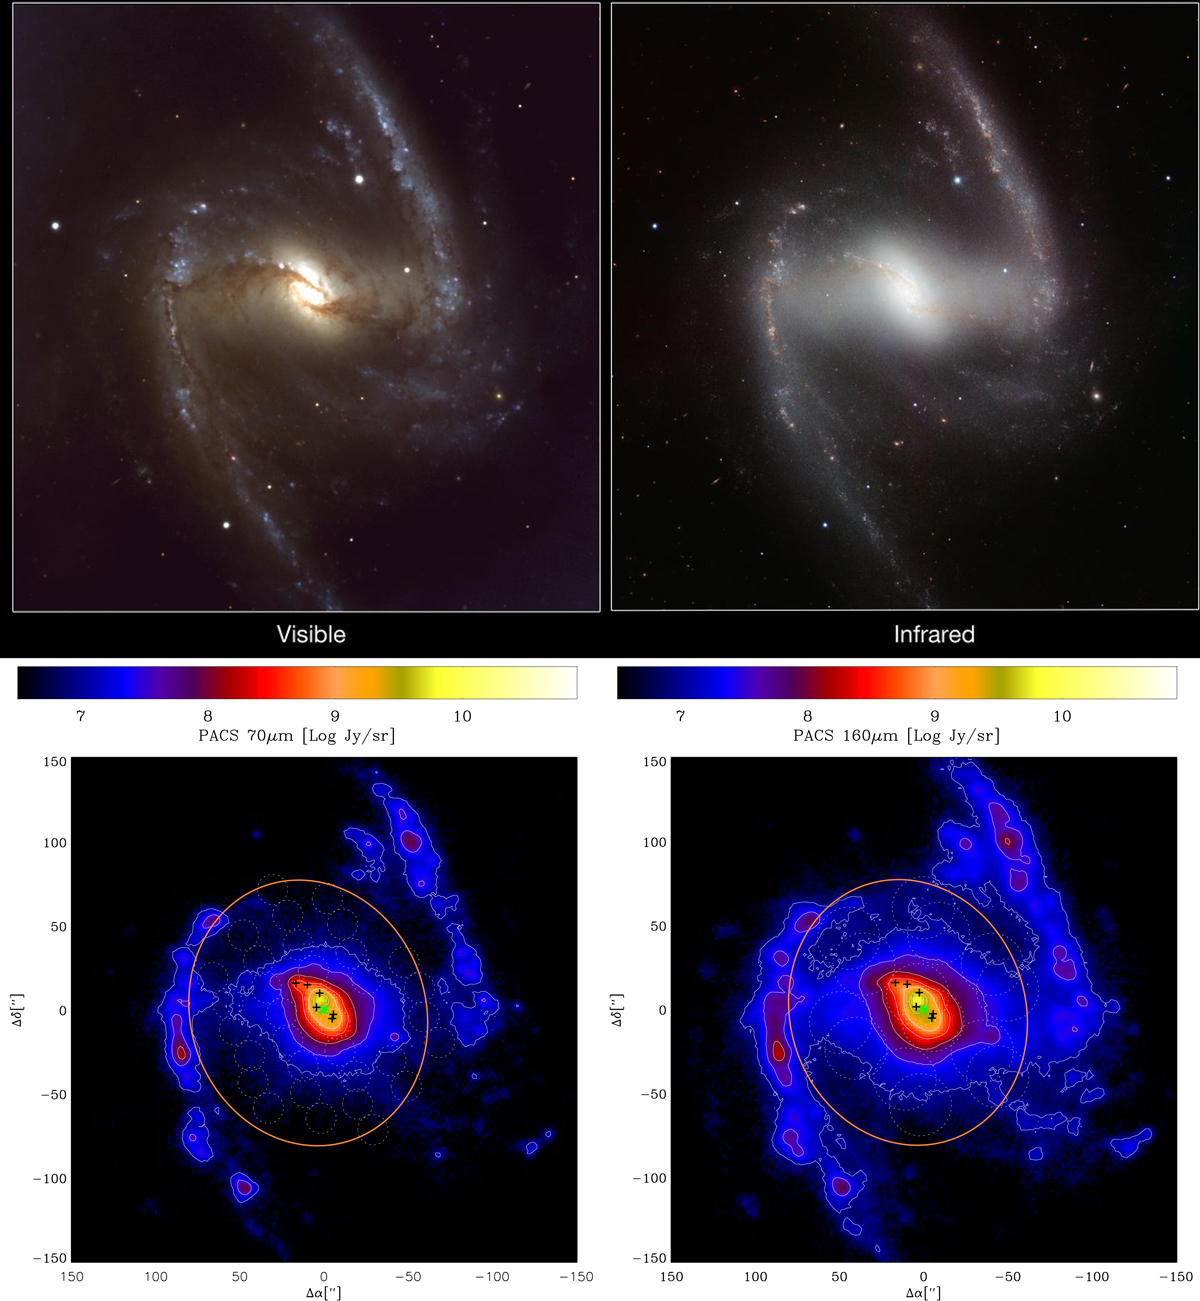
Top: visible-light “true-color” and infrared (0.9−2.5 μm) images of NGC 1365, obtained with ESO’s VLT (ESO/P. Grosböl). Bottom: 70 μm and 160 μm Herschel PACS images of NGC 1365 (beam sizes ![]() and
and ![]() ; Alonso-Herrero et al. 2012) on which are superimposed the high- and low-frequency beams (20″ and 40″, respectively, dashed circles) of the SPIRE spectrometer for the two sets of observations (toward the NE and southwest (SW) positions, see Sect. 2.1) and the resultant beam (140″ × 160″, solid ellipse) of the Odin observations. The crosses, from top to bottom (in decreasing declination), represent the “hot spot” H II regions L4, L11, L12, L1, L3, and L2 (Alloin et al. 1981). The equatorial offsets are with respect to the optical nucleus, which is marked with a green asterisk.
; Alonso-Herrero et al. 2012) on which are superimposed the high- and low-frequency beams (20″ and 40″, respectively, dashed circles) of the SPIRE spectrometer for the two sets of observations (toward the NE and southwest (SW) positions, see Sect. 2.1) and the resultant beam (140″ × 160″, solid ellipse) of the Odin observations. The crosses, from top to bottom (in decreasing declination), represent the “hot spot” H II regions L4, L11, L12, L1, L3, and L2 (Alloin et al. 1981). The equatorial offsets are with respect to the optical nucleus, which is marked with a green asterisk.
Current usage metrics show cumulative count of Article Views (full-text article views including HTML views, PDF and ePub downloads, according to the available data) and Abstracts Views on Vision4Press platform.
Data correspond to usage on the plateform after 2015. The current usage metrics is available 48-96 hours after online publication and is updated daily on week days.
Initial download of the metrics may take a while.