Fig. 24.
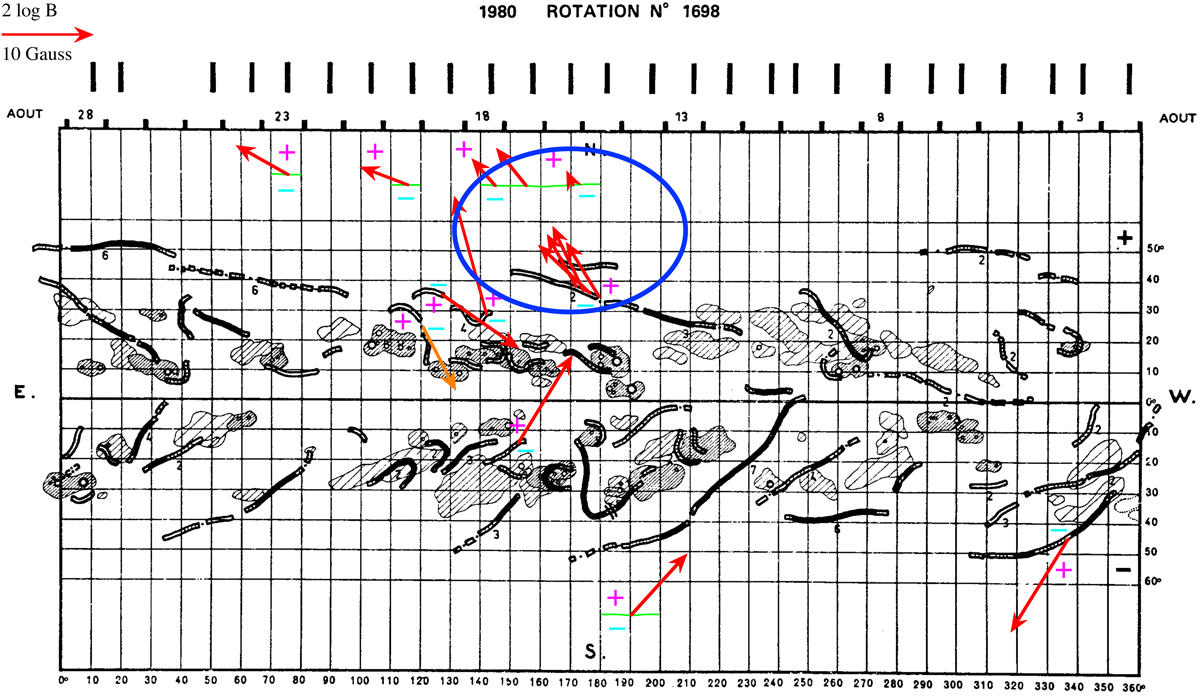
Synoptic map of rotation 1698. Horizontal axis: Carrington longitude. Vertical axis: Solar latitude. The neutral lines of the photospheric magnetic field taken from the McIntosh maps are added as green lines, and the polarities of the photospheric magnetic field also taken from the McIntosh maps are referred to with plus (for positive polarity, in purple) and minus (for negative polarity, in cyan) signs on either side of the neutral lines. Each measured magnetic field vector (average on an observed prominence) is represented by a vector of length 2log B. This length for B = 10 Gauss is plotted in the upper left corner. The magnetic field arrow is plotted in red when the ambiguity is resolved by applying the polarity method. The magnetic field arrow is plotted in orange when the ambiguity is resolved by applying the chirality method. The blue circle embraces parallel filament lines (with an in-between filament line) with alternating long-axis magnetic field components, as in Fig. 5 of Leroy et al. (1983).
Current usage metrics show cumulative count of Article Views (full-text article views including HTML views, PDF and ePub downloads, according to the available data) and Abstracts Views on Vision4Press platform.
Data correspond to usage on the plateform after 2015. The current usage metrics is available 48-96 hours after online publication and is updated daily on week days.
Initial download of the metrics may take a while.