Fig. 3.
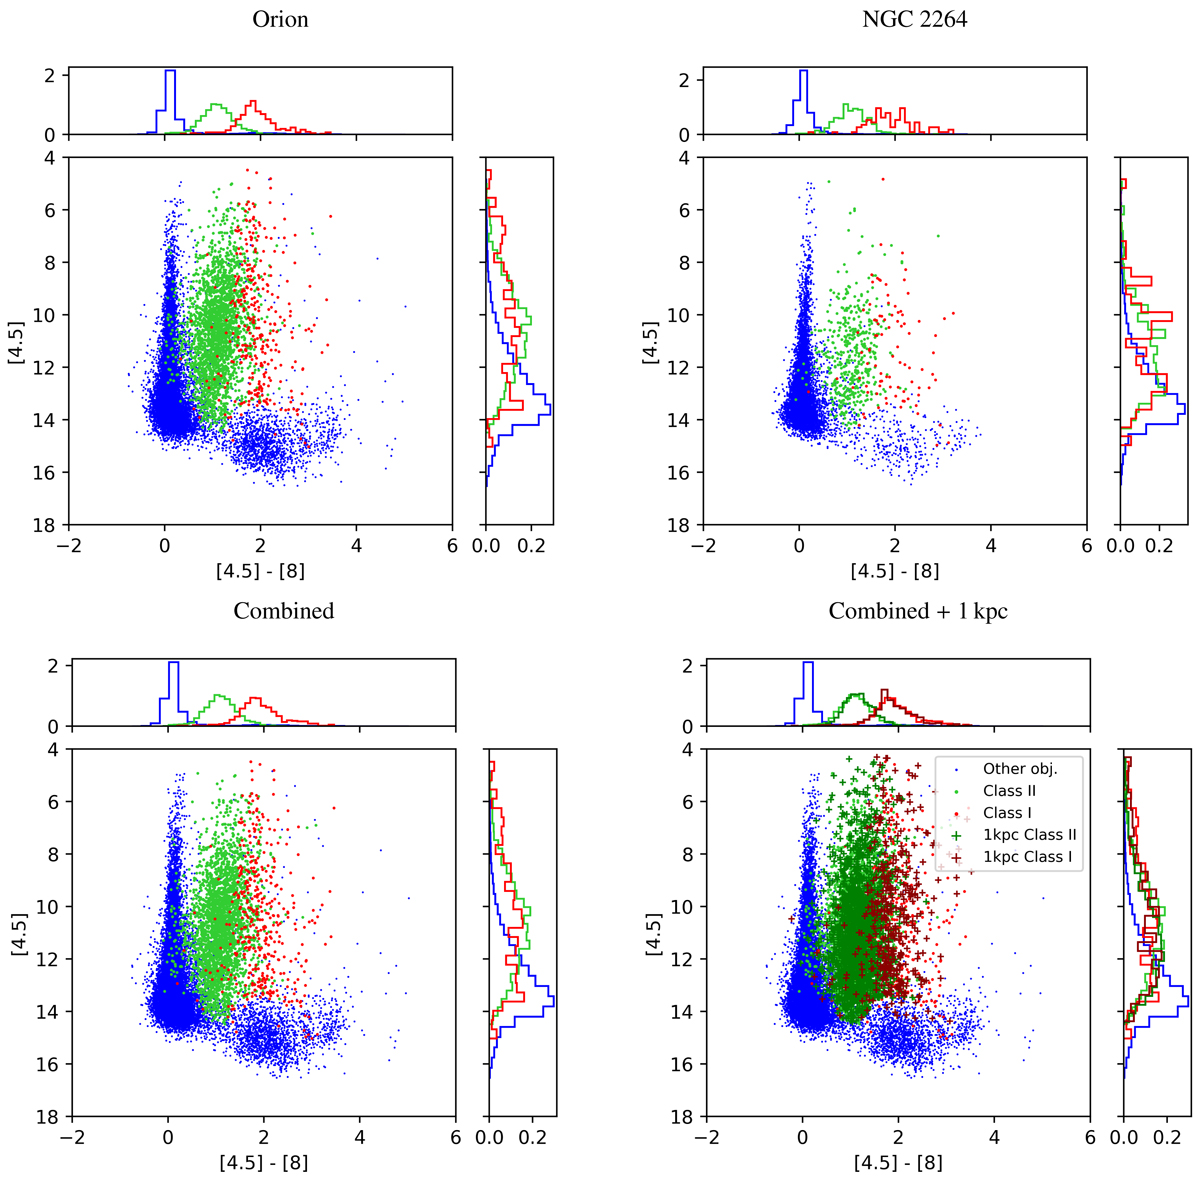
Differences in feature space coverage for our datasets. The CI YSOs, CII YSOs, and contaminants are shown in red, green, and blue, respectively, according to the simplified G09 classification scheme. The crosses in the last frame show the YSOs from the 1 kpc sample. In the side frames, the area of each histogram is normalized to one.
Current usage metrics show cumulative count of Article Views (full-text article views including HTML views, PDF and ePub downloads, according to the available data) and Abstracts Views on Vision4Press platform.
Data correspond to usage on the plateform after 2015. The current usage metrics is available 48-96 hours after online publication and is updated daily on week days.
Initial download of the metrics may take a while.