Free Access
Fig. 9
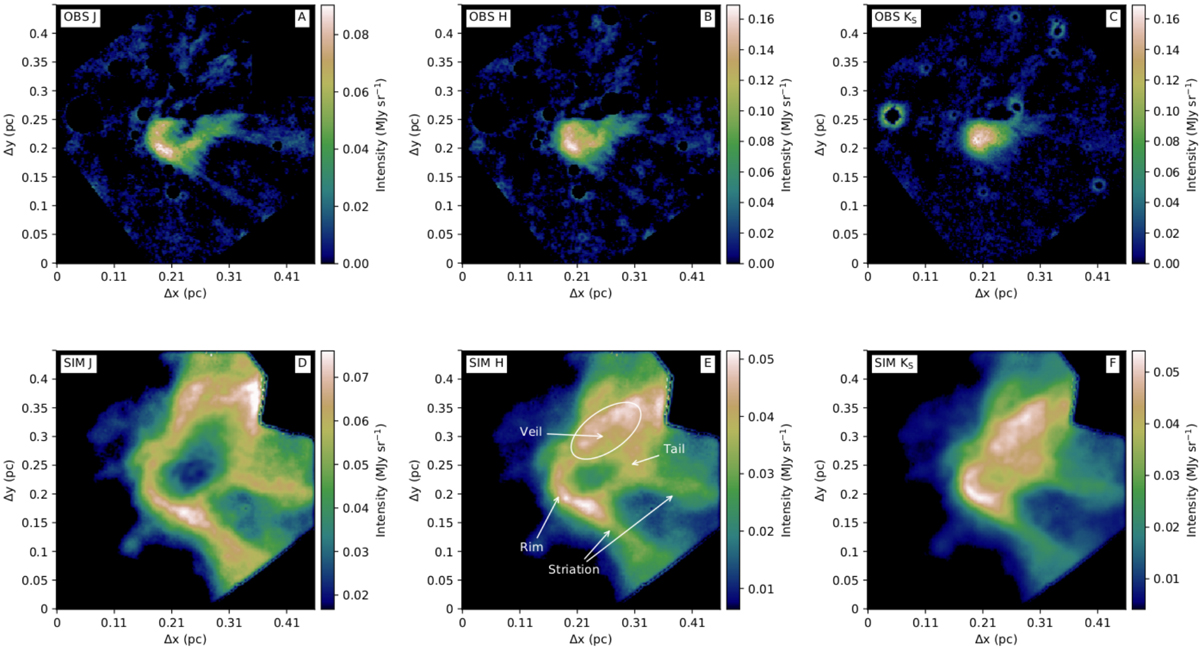
Observed (first row) and estimated surface brightness maps from the Default model at the J, H, and KS bands (second row). All maps have been background substracted.
Current usage metrics show cumulative count of Article Views (full-text article views including HTML views, PDF and ePub downloads, according to the available data) and Abstracts Views on Vision4Press platform.
Data correspond to usage on the plateform after 2015. The current usage metrics is available 48-96 hours after online publication and is updated daily on week days.
Initial download of the metrics may take a while.