Fig. 5
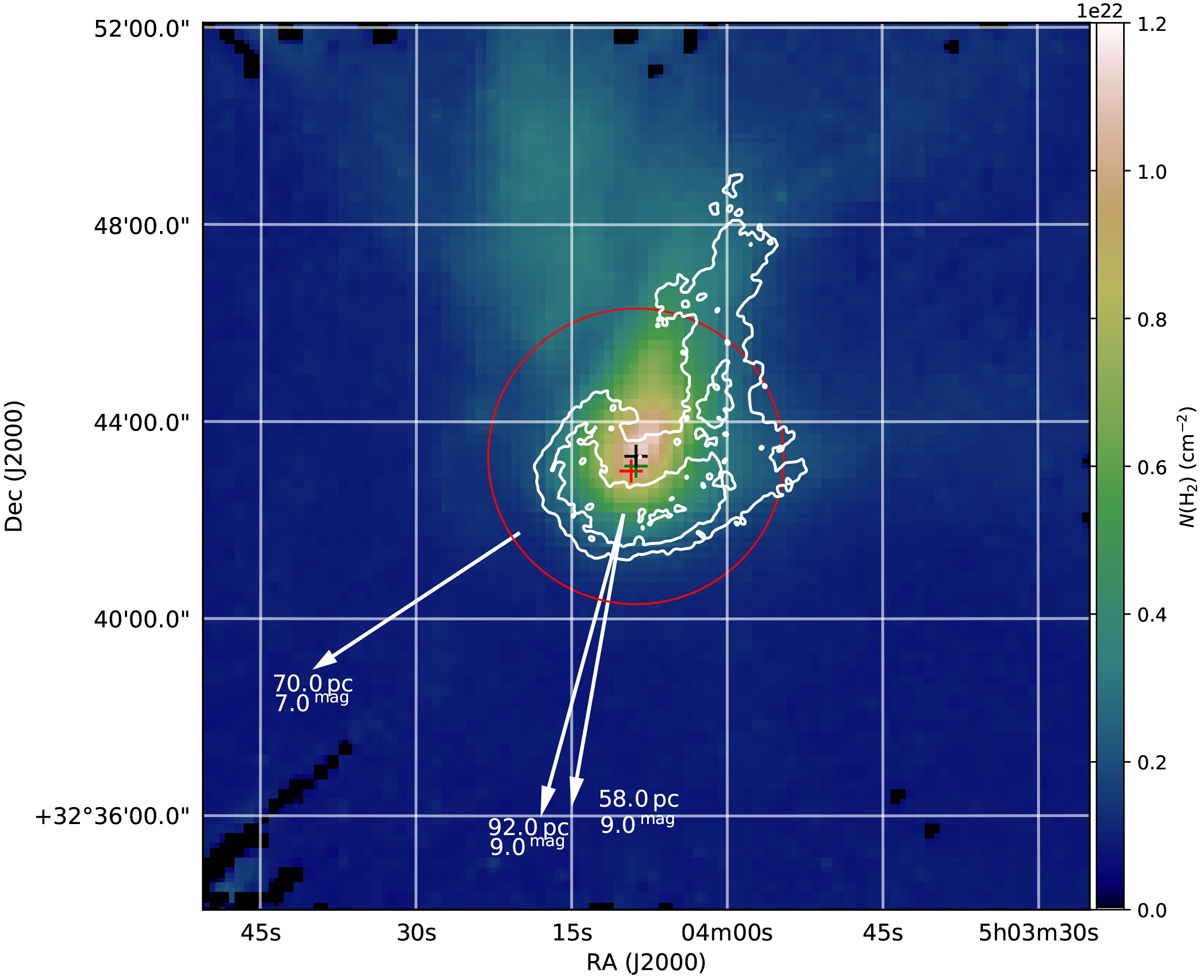
Contours of J-band surface brightness on Herschel column density map. The plus signs show the locations of the 250, 350, and 500 μm emission maxima (red, green, and black, respectively). The white arrows indicate the projected direction of the three brightest nearby stars and the numbers next to the arrows indicate the 3D distance to the star and the Gaia G band average magnitude. The red circle shows the area that is used to compute the KISRF scaling factor.
Current usage metrics show cumulative count of Article Views (full-text article views including HTML views, PDF and ePub downloads, according to the available data) and Abstracts Views on Vision4Press platform.
Data correspond to usage on the plateform after 2015. The current usage metrics is available 48-96 hours after online publication and is updated daily on week days.
Initial download of the metrics may take a while.