Free Access
Fig. 3
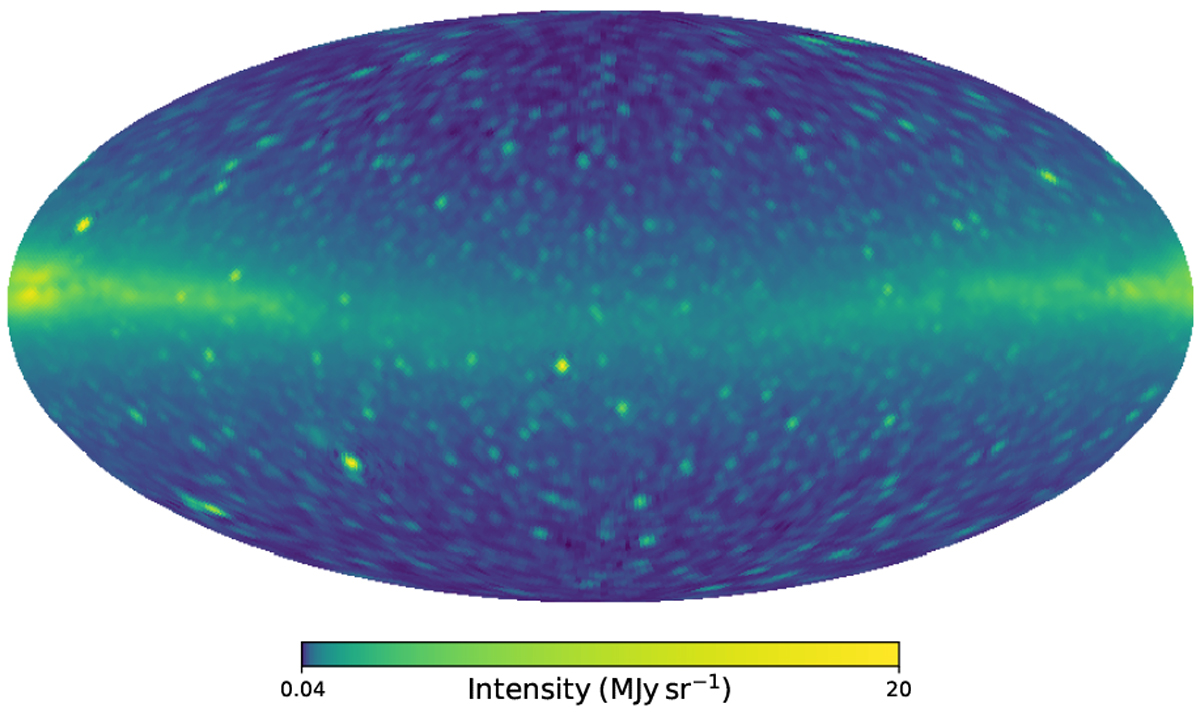
Model for the all-sky sky brightness distribution in the J band. The map has been rotated so that the direction towards L1512 is in the centre. The intensity of the model has been truncated at 20 MJy sr−1 for plotting and the image has been smoothed by a Gaussian with FWHM = 2°.
Current usage metrics show cumulative count of Article Views (full-text article views including HTML views, PDF and ePub downloads, according to the available data) and Abstracts Views on Vision4Press platform.
Data correspond to usage on the plateform after 2015. The current usage metrics is available 48-96 hours after online publication and is updated daily on week days.
Initial download of the metrics may take a while.