Fig. E.5
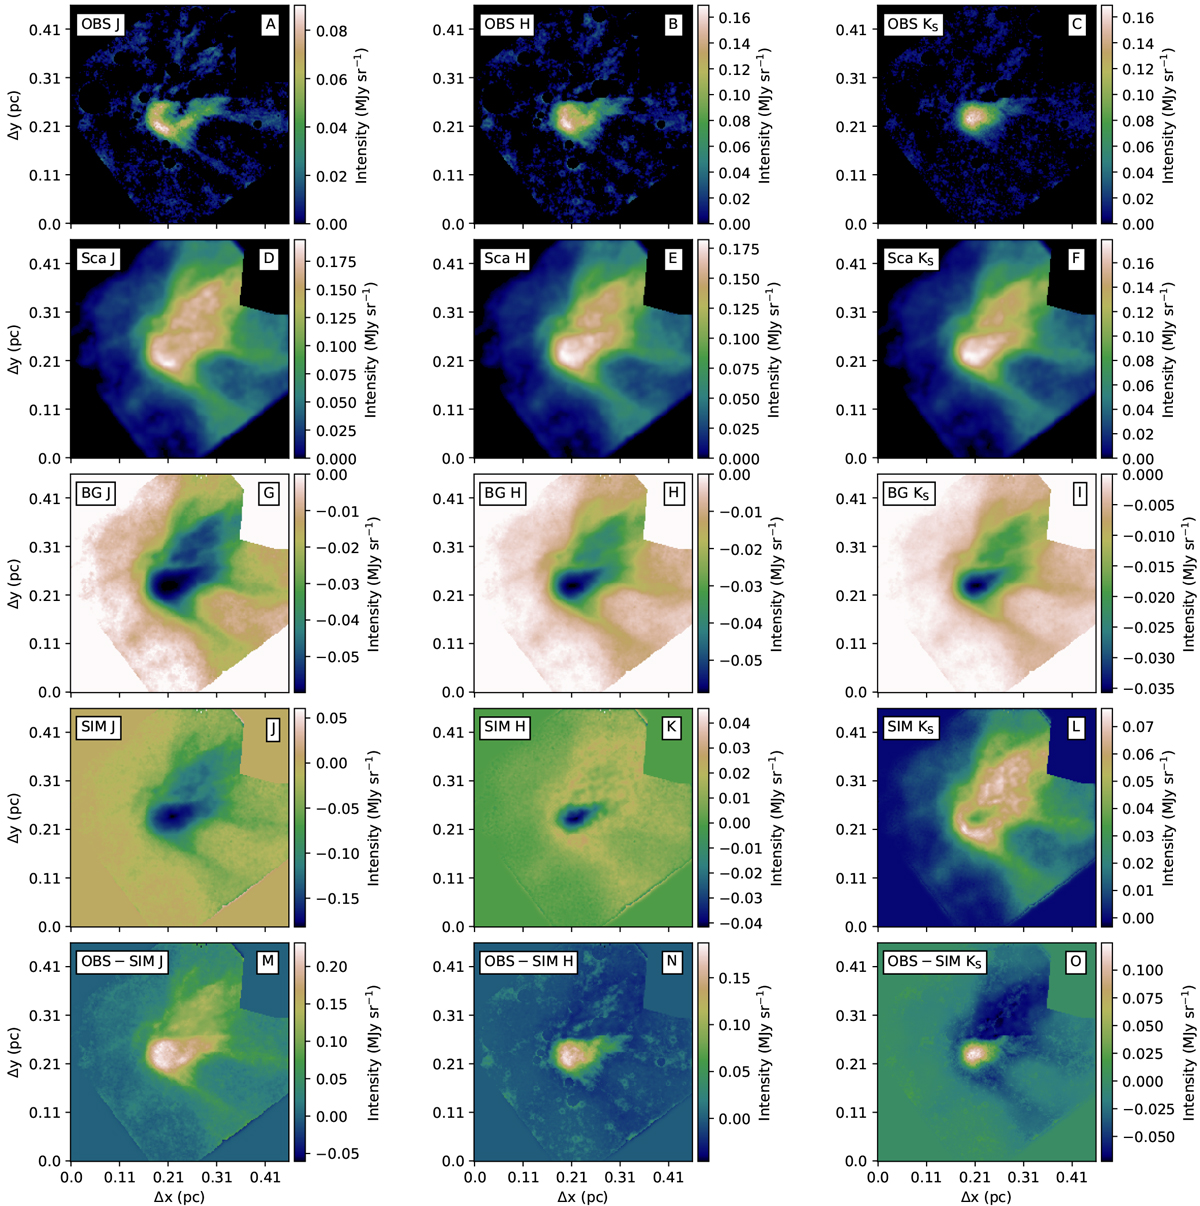
Different components in the surface brightness maps for the Default model. Shown on the first row are the background subtracted observed surface brightnesses and the second row shows the simulated scattered light without the background subtraction. Shown on the third row is the component of the background that is seen trough the cloud (attenuated by a factor of e−τ) and the fourth row shows the background subtracted simulated surface brightness. The last row shows the difference between the observed and simulated background subtracted surface brightness.
Current usage metrics show cumulative count of Article Views (full-text article views including HTML views, PDF and ePub downloads, according to the available data) and Abstracts Views on Vision4Press platform.
Data correspond to usage on the plateform after 2015. The current usage metrics is available 48-96 hours after online publication and is updated daily on week days.
Initial download of the metrics may take a while.