Fig. 14
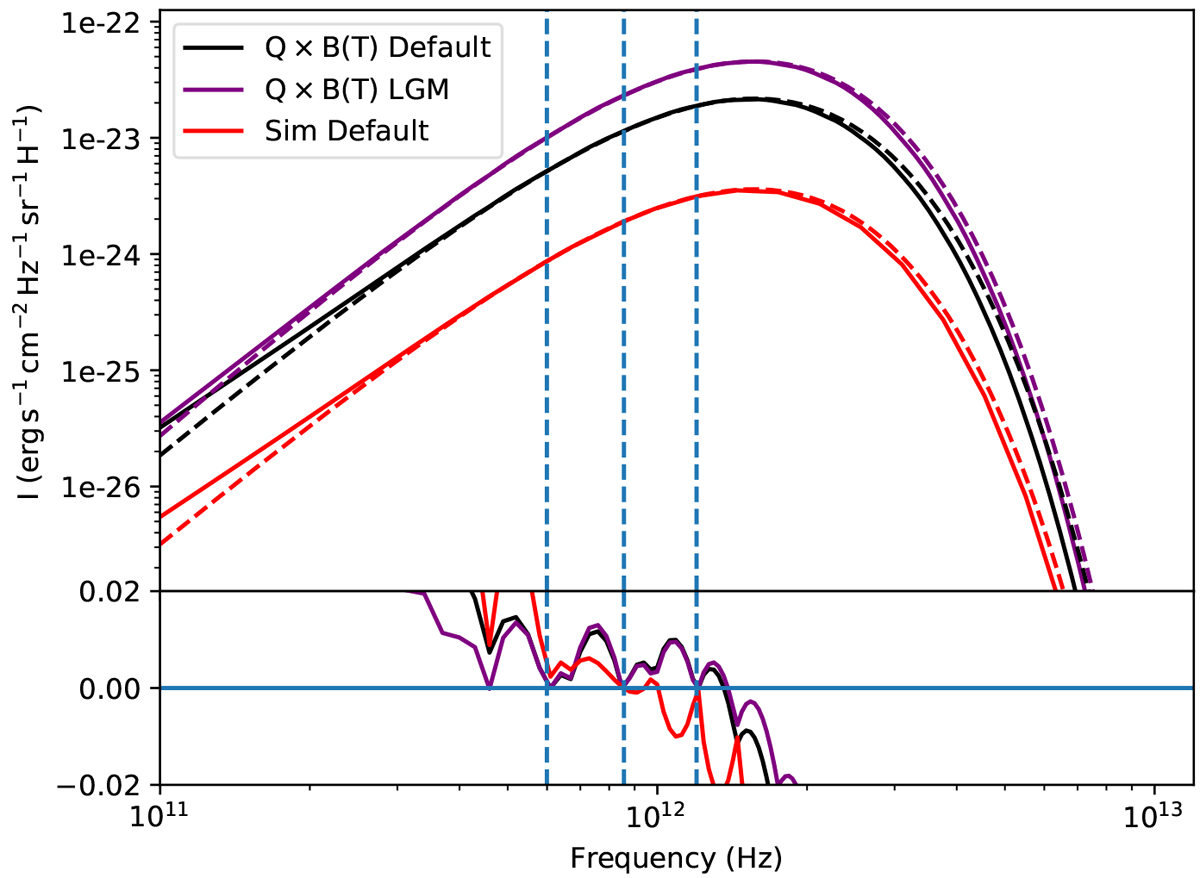
Comparison of dust emission spectra and their MBB fits. The black and purple lines show the emission spectra for Default and LGM models with grains at 15 K temperature. The dashed lines show MBB spectra fitted to the 250, 350, and 500 μm points. The resulting fit parameters are Tc = 16.48, β = 1.62 and Tc = 15.85, β = 1.79, for the Default and LGM models, respectively. The red curve (scaled by a factor of 1.0 × 10⁻³⁰ to fit the figure) is from a simulated Default model map pixel where the fitted temperature is similar to that of the black curve. The blue vertical lines show the 250, 350, and 500 μm frequencies.The relative differences between the black-bodies and the MBB fits near the 250, 350, and 500 μm points are shown in the plot below the emission spectra curves.
Current usage metrics show cumulative count of Article Views (full-text article views including HTML views, PDF and ePub downloads, according to the available data) and Abstracts Views on Vision4Press platform.
Data correspond to usage on the plateform after 2015. The current usage metrics is available 48-96 hours after online publication and is updated daily on week days.
Initial download of the metrics may take a while.