Fig. 11
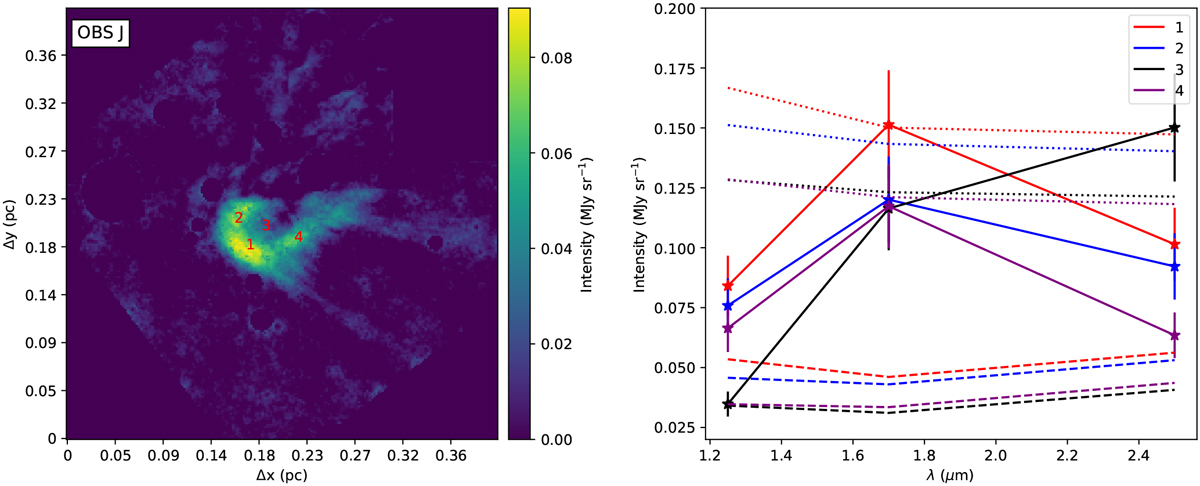
Observed map of the J band scattered light (left panel), the red numbers from one to four indicate the locations from where we have extracted NIR spectra, shown in the right panel. The solid lines show the observed spectra and the dashed lines show the spectra derived from the Default model. The dotted lines show the simulated spectra derived from the Default model, but the intensity of the scattered light has been multiplied by a factor of three before background subtraction.
Current usage metrics show cumulative count of Article Views (full-text article views including HTML views, PDF and ePub downloads, according to the available data) and Abstracts Views on Vision4Press platform.
Data correspond to usage on the plateform after 2015. The current usage metrics is available 48-96 hours after online publication and is updated daily on week days.
Initial download of the metrics may take a while.