Fig. 9.
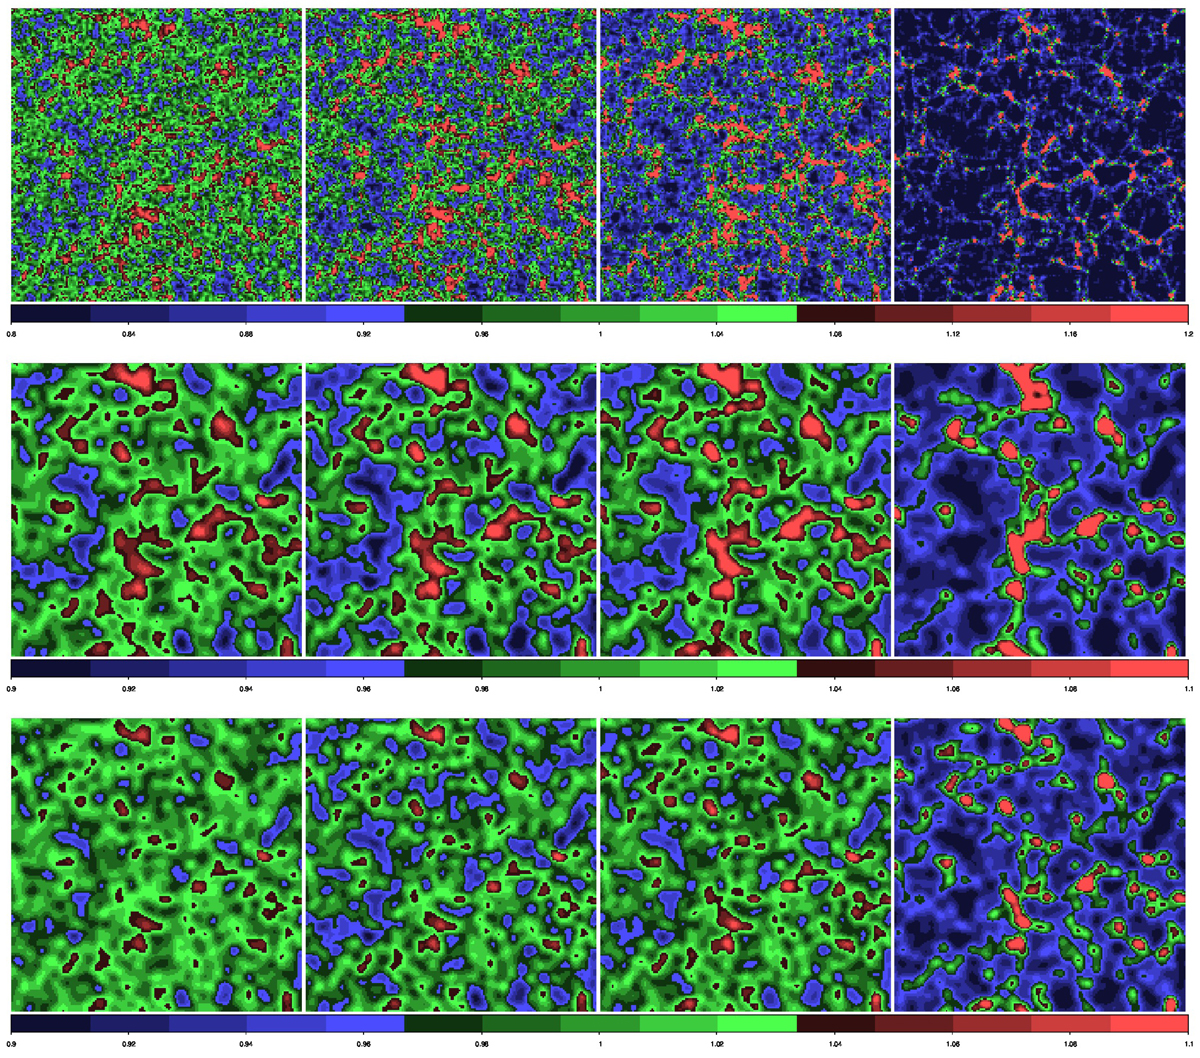
Evolution of the density fields of LCDM and SCDM models. Upper panels: density fields of the LCDM model found with a smoothing kernel of radius 2 h−1 Mpc. Middle and lower panels: density fields of the LCDM and SCDM models found with a smoothing kernel with a radius 8 h−1 Mpc. The panels from left to right correspond to epochs z = 30, 10, 3, and 0. Cross sections are shown in a 2 h−1 Mpc thick layer of size 341 × 341 h−1 Mpc. Densities are expressed on a linear scale. Colour scales from left to right in the upper panel are 0.8−1.2, 0.6−1.45, 0.3−2, and 0.1−5.0, and in the middle and lower panels, they are 0.9−1.1, 0.8−1.25, 0.4−1.65, and 0.2−3.0.
Current usage metrics show cumulative count of Article Views (full-text article views including HTML views, PDF and ePub downloads, according to the available data) and Abstracts Views on Vision4Press platform.
Data correspond to usage on the plateform after 2015. The current usage metrics is available 48-96 hours after online publication and is updated daily on week days.
Initial download of the metrics may take a while.