Fig. 5.
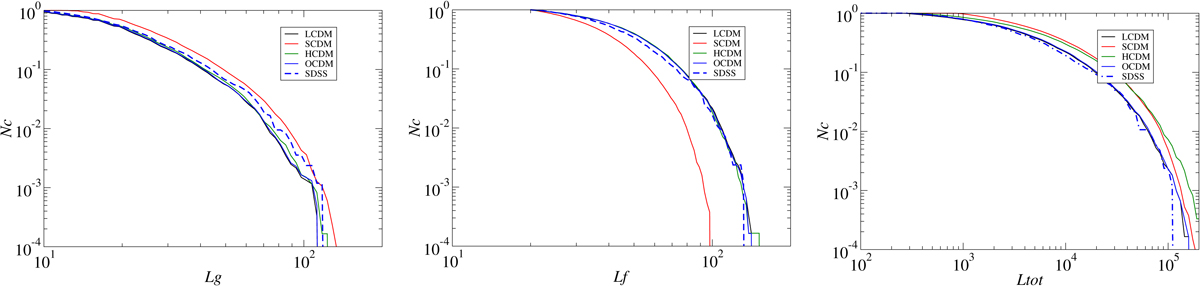
Comparison of the cumulative diameter and mass (luminosities) distribution of models at the present epoch and the SDSS samples. Left panel: cumulative distributions of supercluster geometrical diameters Lg, middle panel: distributions of the fitness diameters Lf, and right panel: total mass (luminosity) distributions ℒ, given in units of the mass (luminosity) of one cell. The SDSS distributions are given for a threshold density Dt = 5.4, and the distribution of SDSS total luminosities is calculated for a correction factor b = 1.45.
Current usage metrics show cumulative count of Article Views (full-text article views including HTML views, PDF and ePub downloads, according to the available data) and Abstracts Views on Vision4Press platform.
Data correspond to usage on the plateform after 2015. The current usage metrics is available 48-96 hours after online publication and is updated daily on week days.
Initial download of the metrics may take a while.