Fig. 4.
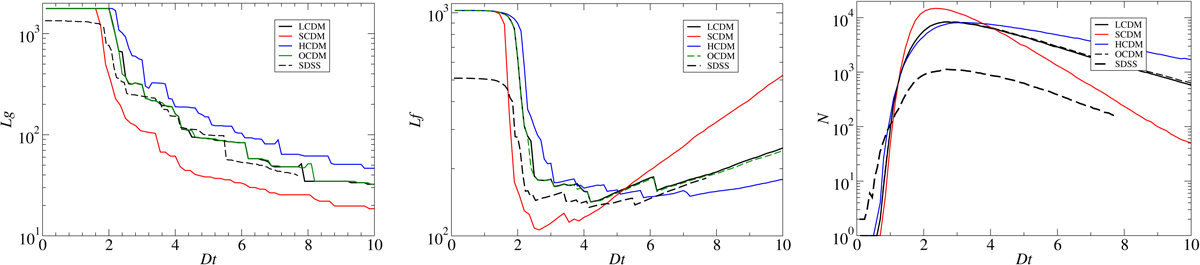
Comparison of the percolation functions of models with SDSS samples. The model functions are plotted with coloured bold lines. The functions for SDSS samples are plotted with dashed black lines for the density correction factor 1.30. Left panel: geometrical length functions, middle panel: fitness length functions, and right panel: number functions.
Current usage metrics show cumulative count of Article Views (full-text article views including HTML views, PDF and ePub downloads, according to the available data) and Abstracts Views on Vision4Press platform.
Data correspond to usage on the plateform after 2015. The current usage metrics is available 48-96 hours after online publication and is updated daily on week days.
Initial download of the metrics may take a while.