Fig. 7.
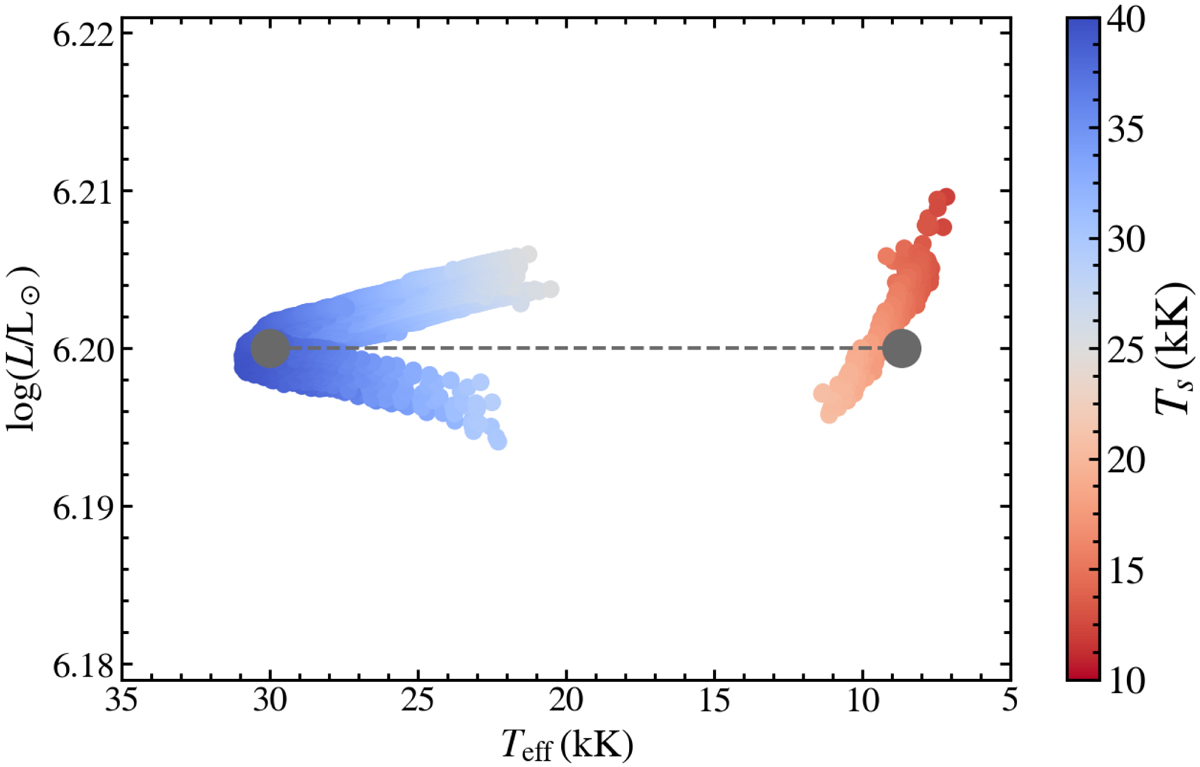
Several cycles from our evolutionary models in Sect. 4 in the HR diagram, color-coded according to their sonic-point temperature. Each dot corresponds to a computed stellar model during our evolutionary calculation. Superposed, we show the location in the HR diagram of the minimum and maximum brightness phase of AG Carinae (gray dots and dashed line) from Vink (2012, Fig. 1). The effective temperature at optical depth unity is estimated with the wind models discussed in Sect. 2, while the bolometric luminosity has been decreased by 0.05 dex to correspond to that of AG Carinae.
Current usage metrics show cumulative count of Article Views (full-text article views including HTML views, PDF and ePub downloads, according to the available data) and Abstracts Views on Vision4Press platform.
Data correspond to usage on the plateform after 2015. The current usage metrics is available 48-96 hours after online publication and is updated daily on week days.
Initial download of the metrics may take a while.