Fig. 5.
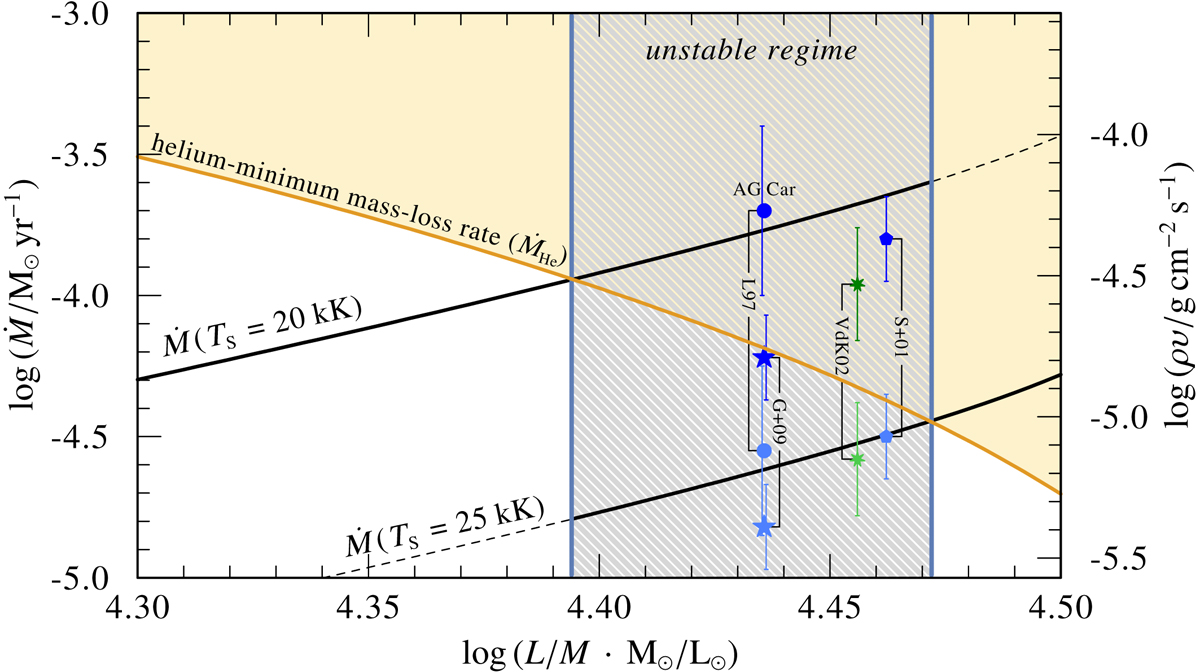
Minimum mass-loss rate (left axis) and minimum mass-flux (right axis) for the sonic point of a radiation-driven outflow to lie in the temperature range of the He II-opacity bump (thick orange line) as a function of L/M. The helium-minimum mass-loss rate is derived based on the opacity tables (see Appendices B and C) adopting a sonic-point radius of 62 R⊙ (Groh et al. 2011), Y = 0.6 (Groh et al. 2009), and a turbulent velocity broadening of 20 km s−1 (Groh et al. 2011). The luminosity and mass adopted for AG Car are 1.5 ⋅ 106 L⊙ and 55 M⊙ (Groh et al. 2011; Vamvatira-Nakou et al. 2015). The blue points indicate the minimum and maximum mass-loss rates of AG Carinae from Groh et al. (2011, stars), Leitherer et al. (1994 circles), and Stahl et al. (2001, pentagons), as well as the numerical predictions specific to AG Carinae by Vink & de Koter (2002, green asterisks). The black lines indicate the mass-loss rate predictions on the hot (25 kK, lower line) and cool (20 kK, upper line) side of the bistability temperature (Vink et al. 2001), derived adopting a mass-luminosity relation (Gräfener et al. 2011). The gray area indicates the L/M range where we predict massive main-sequence stars might undergo an S Dor phase (cf. Appendix D).
Current usage metrics show cumulative count of Article Views (full-text article views including HTML views, PDF and ePub downloads, according to the available data) and Abstracts Views on Vision4Press platform.
Data correspond to usage on the plateform after 2015. The current usage metrics is available 48-96 hours after online publication and is updated daily on week days.
Initial download of the metrics may take a while.