Fig. 4.
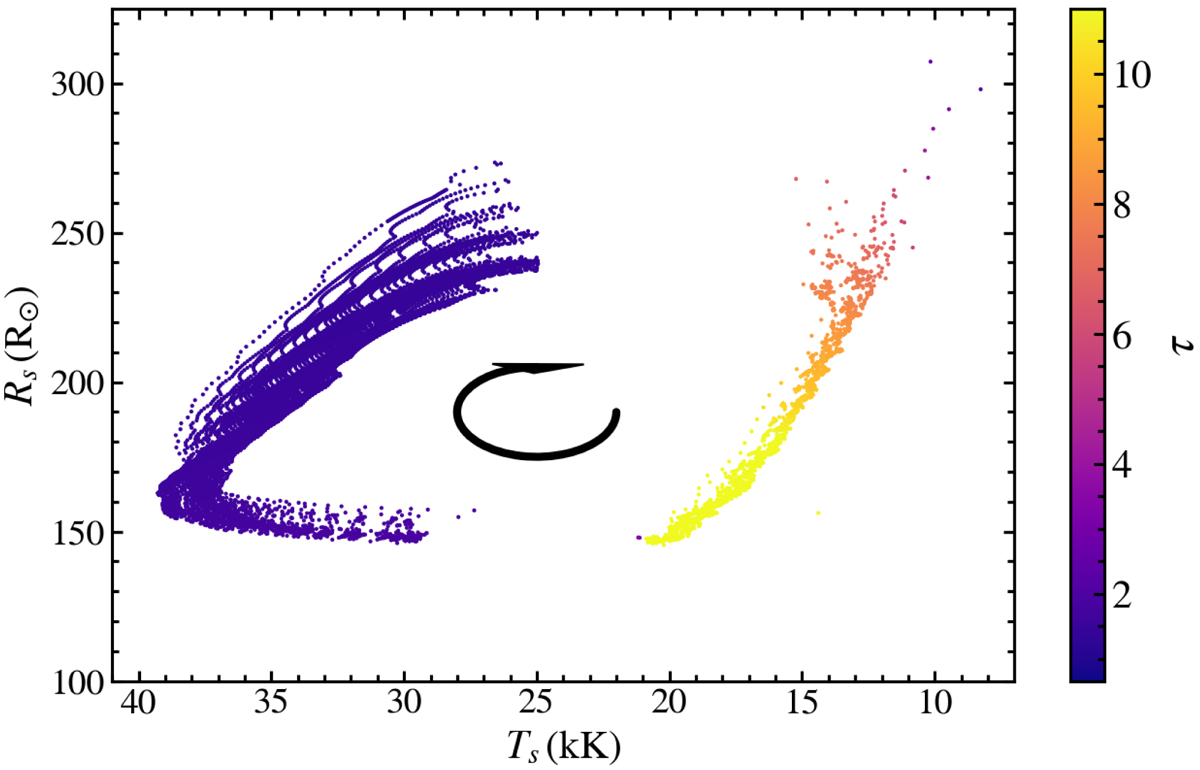
Sonic-point radius and temperature during the ≈3 * 103 yr of evolution of our numerical calculations (Sect. 4 and Fig. 3). Each point corresponds to a model (≈100 000 models), color-coded as a function of the estimated optical depth at the sonic point (color bar on the right side). The S Dor cycle proceeds clockwise, as indicated by the black arrow.
Current usage metrics show cumulative count of Article Views (full-text article views including HTML views, PDF and ePub downloads, according to the available data) and Abstracts Views on Vision4Press platform.
Data correspond to usage on the plateform after 2015. The current usage metrics is available 48-96 hours after online publication and is updated daily on week days.
Initial download of the metrics may take a while.