Fig. 2.
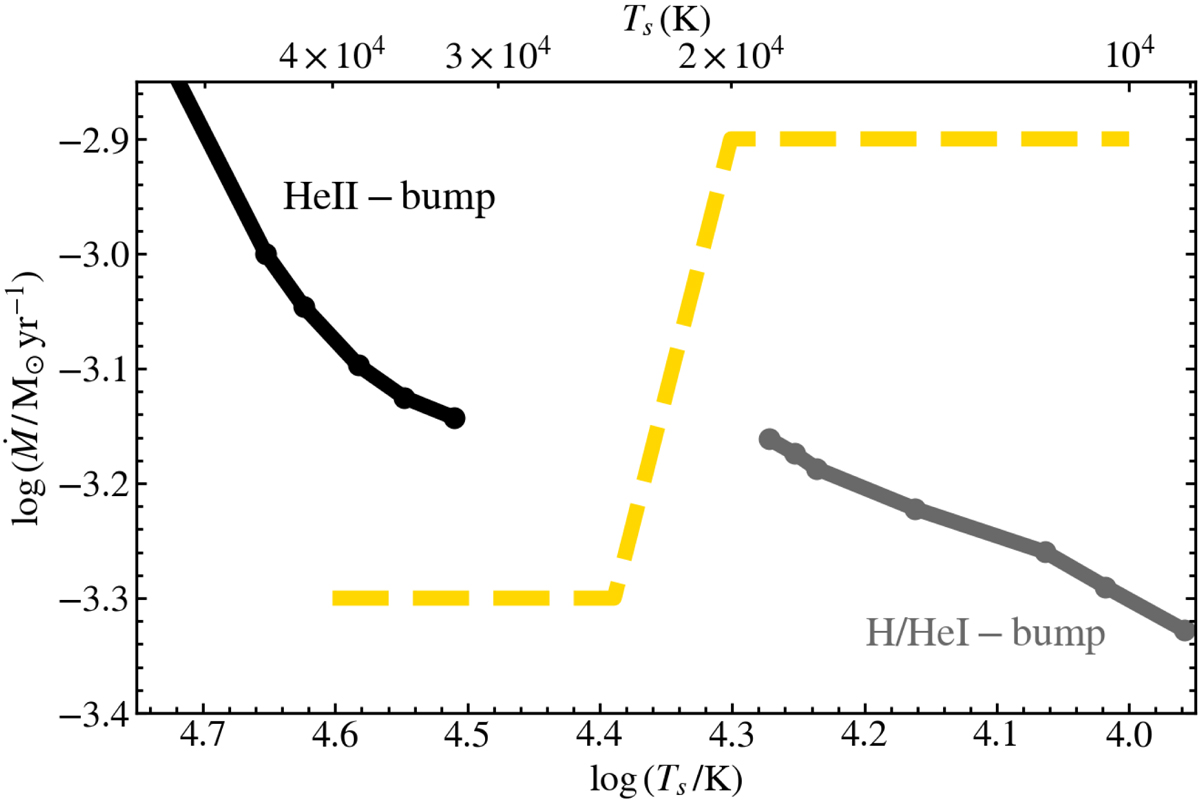
Sonic-point temperatures derived from a set of 73 M⊙ stationary hydrodynamic stellar models, adopting several constant mass-loss rates. The sonic points located in the temperature range of the He II opacity bump are shown as solid black, while those located in the temperature range of the H/He I opacity bump are shown as solid gray. The two ranges are separated by the forbidden temperature range (Sect. 3). Superposed is the temperature-dependent mass-loss prescription adopted in our time-dependent calculations (dashed gold, see Sect. 4).
Current usage metrics show cumulative count of Article Views (full-text article views including HTML views, PDF and ePub downloads, according to the available data) and Abstracts Views on Vision4Press platform.
Data correspond to usage on the plateform after 2015. The current usage metrics is available 48-96 hours after online publication and is updated daily on week days.
Initial download of the metrics may take a while.