Fig. 7.
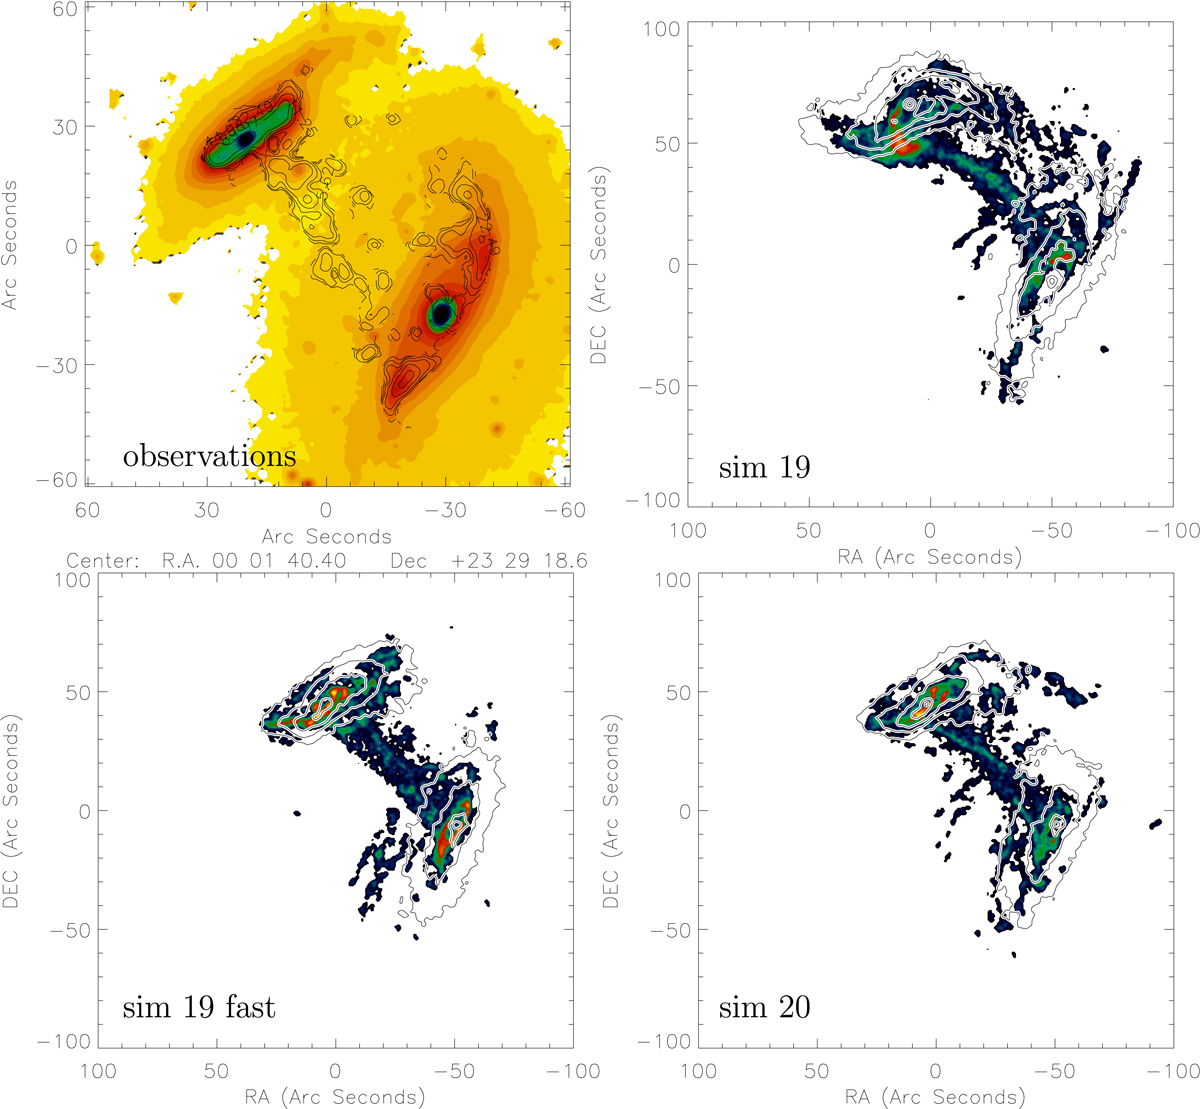
CO(1−0) moment 0 maps together with the model H2 moment 0 maps. Upper left panel: PdBI observations (contour) together with the Spitzer 3.6 μm map. The contour levels are (0.35, 0.7, 1.4, 2.8, 5.6, 11.2, 22.5, 45.0, 90.0, 180.0, 360.0) K km s−1. In the other panels, the contours show stellar distribution and the colors indicate molecular gas distribution. The color stretch is the same as the contours of the upper left panel.
Current usage metrics show cumulative count of Article Views (full-text article views including HTML views, PDF and ePub downloads, according to the available data) and Abstracts Views on Vision4Press platform.
Data correspond to usage on the plateform after 2015. The current usage metrics is available 48-96 hours after online publication and is updated daily on week days.
Initial download of the metrics may take a while.