Fig. C.4.
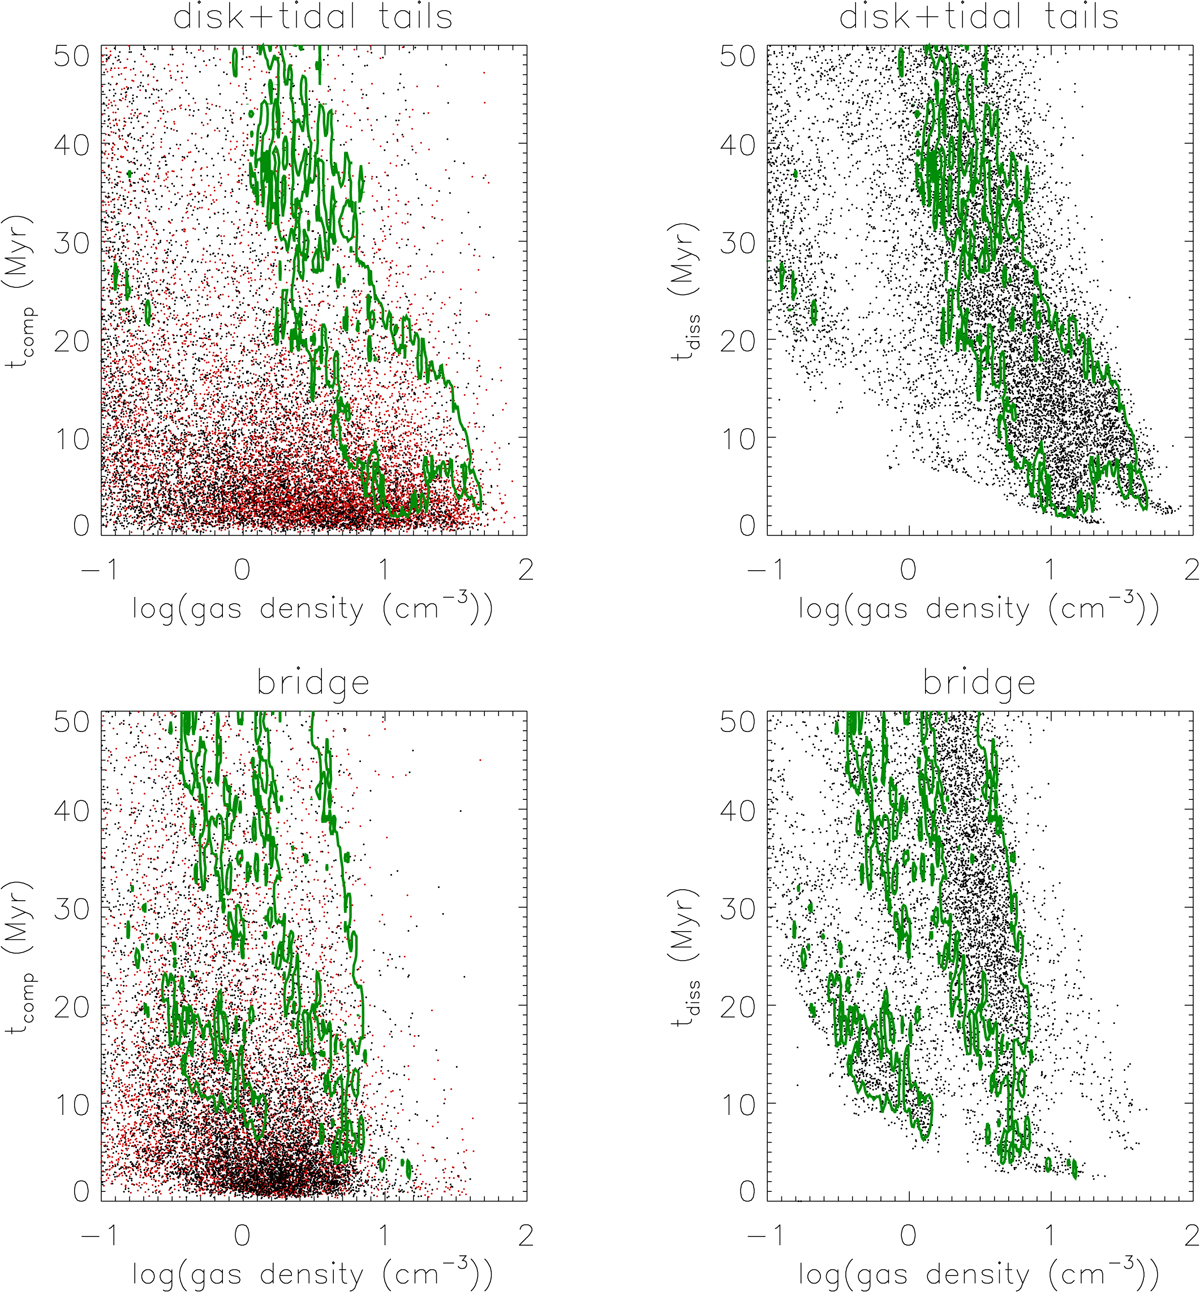
Compression (Eq. (C.8), left panel) and dissipation (Eq. (C.8), right panel) timescales as a function of the mean gas density ⟨ρ⟩ for the timestep of interest of sim19. The meaning of the colors is the same as in Fig. C.3. Upper panels: all gas particles within the geometrically defined disk and tidal tail regions. Lower panels: all gas particles within the geometrically defined bridge region.
Current usage metrics show cumulative count of Article Views (full-text article views including HTML views, PDF and ePub downloads, according to the available data) and Abstracts Views on Vision4Press platform.
Data correspond to usage on the plateform after 2015. The current usage metrics is available 48-96 hours after online publication and is updated daily on week days.
Initial download of the metrics may take a while.