Fig. C.1.
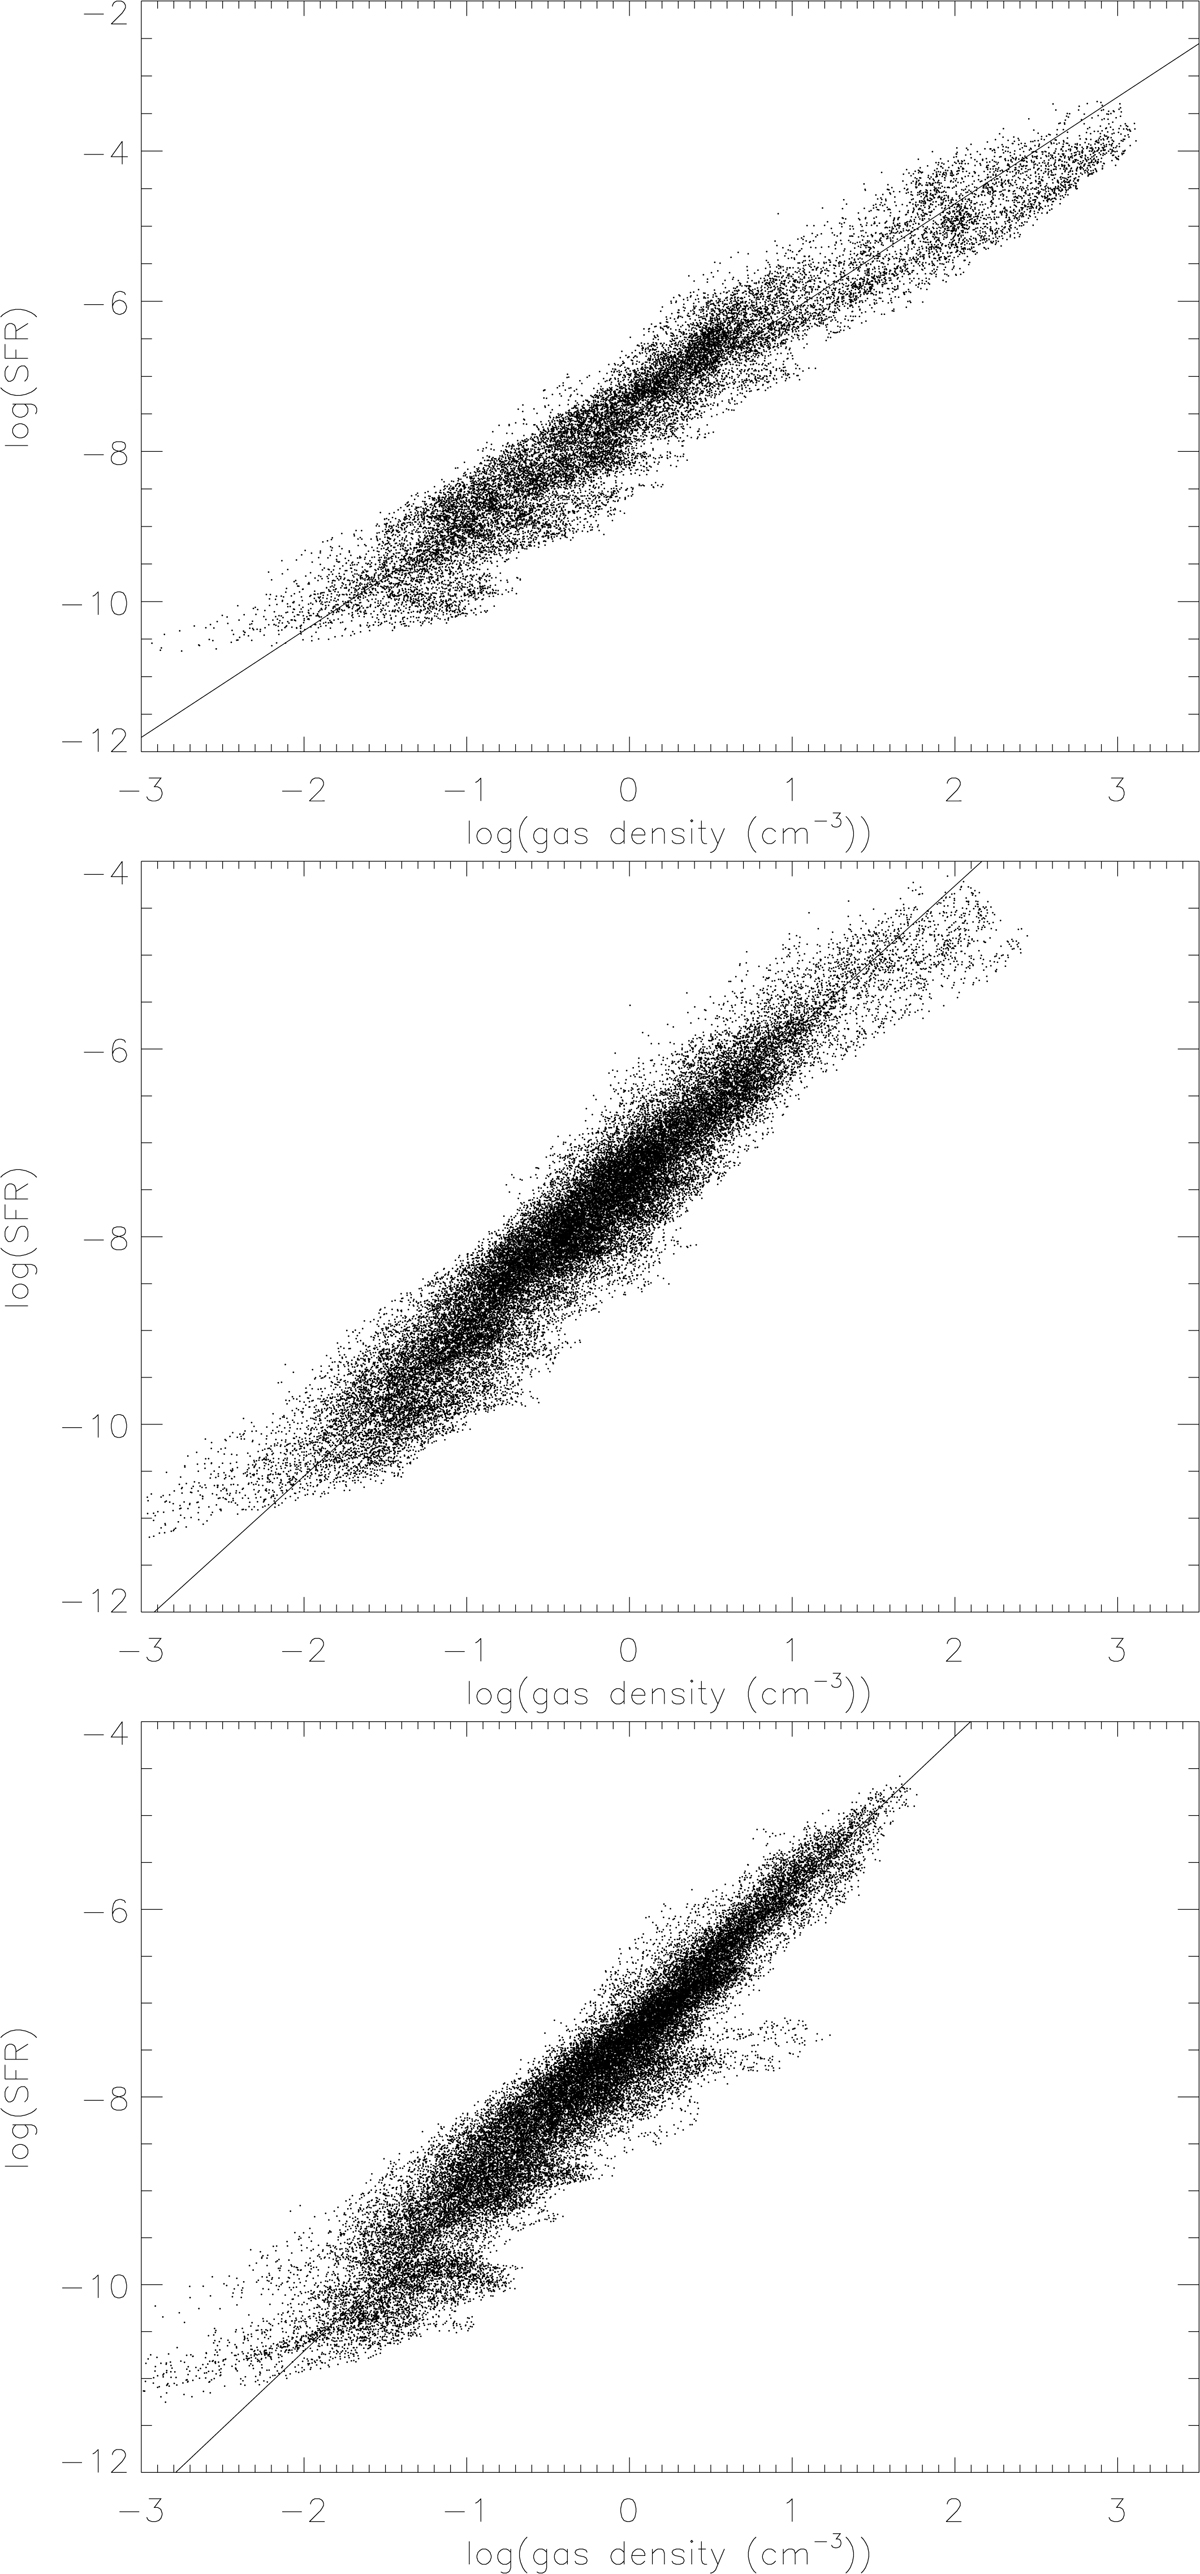
Local SFR ![]() (in arbitrary units) as a function of the volume density ρ. Upper panel: unperturbed simulation after 0.5 Gyr. Middle panel: simulation 19 at impact. Lower panel: simulation 19 20 Myr after impact. Solid lines show linear regressions. The slope of the correlation
(in arbitrary units) as a function of the volume density ρ. Upper panel: unperturbed simulation after 0.5 Gyr. Middle panel: simulation 19 at impact. Lower panel: simulation 19 20 Myr after impact. Solid lines show linear regressions. The slope of the correlation ![]() for the unperturbed galaxy simulation is n = 1.4, whereas it is n = 1.6 for the Taffy simulation.
for the unperturbed galaxy simulation is n = 1.4, whereas it is n = 1.6 for the Taffy simulation.
Current usage metrics show cumulative count of Article Views (full-text article views including HTML views, PDF and ePub downloads, according to the available data) and Abstracts Views on Vision4Press platform.
Data correspond to usage on the plateform after 2015. The current usage metrics is available 48-96 hours after online publication and is updated daily on week days.
Initial download of the metrics may take a while.