Fig. 6
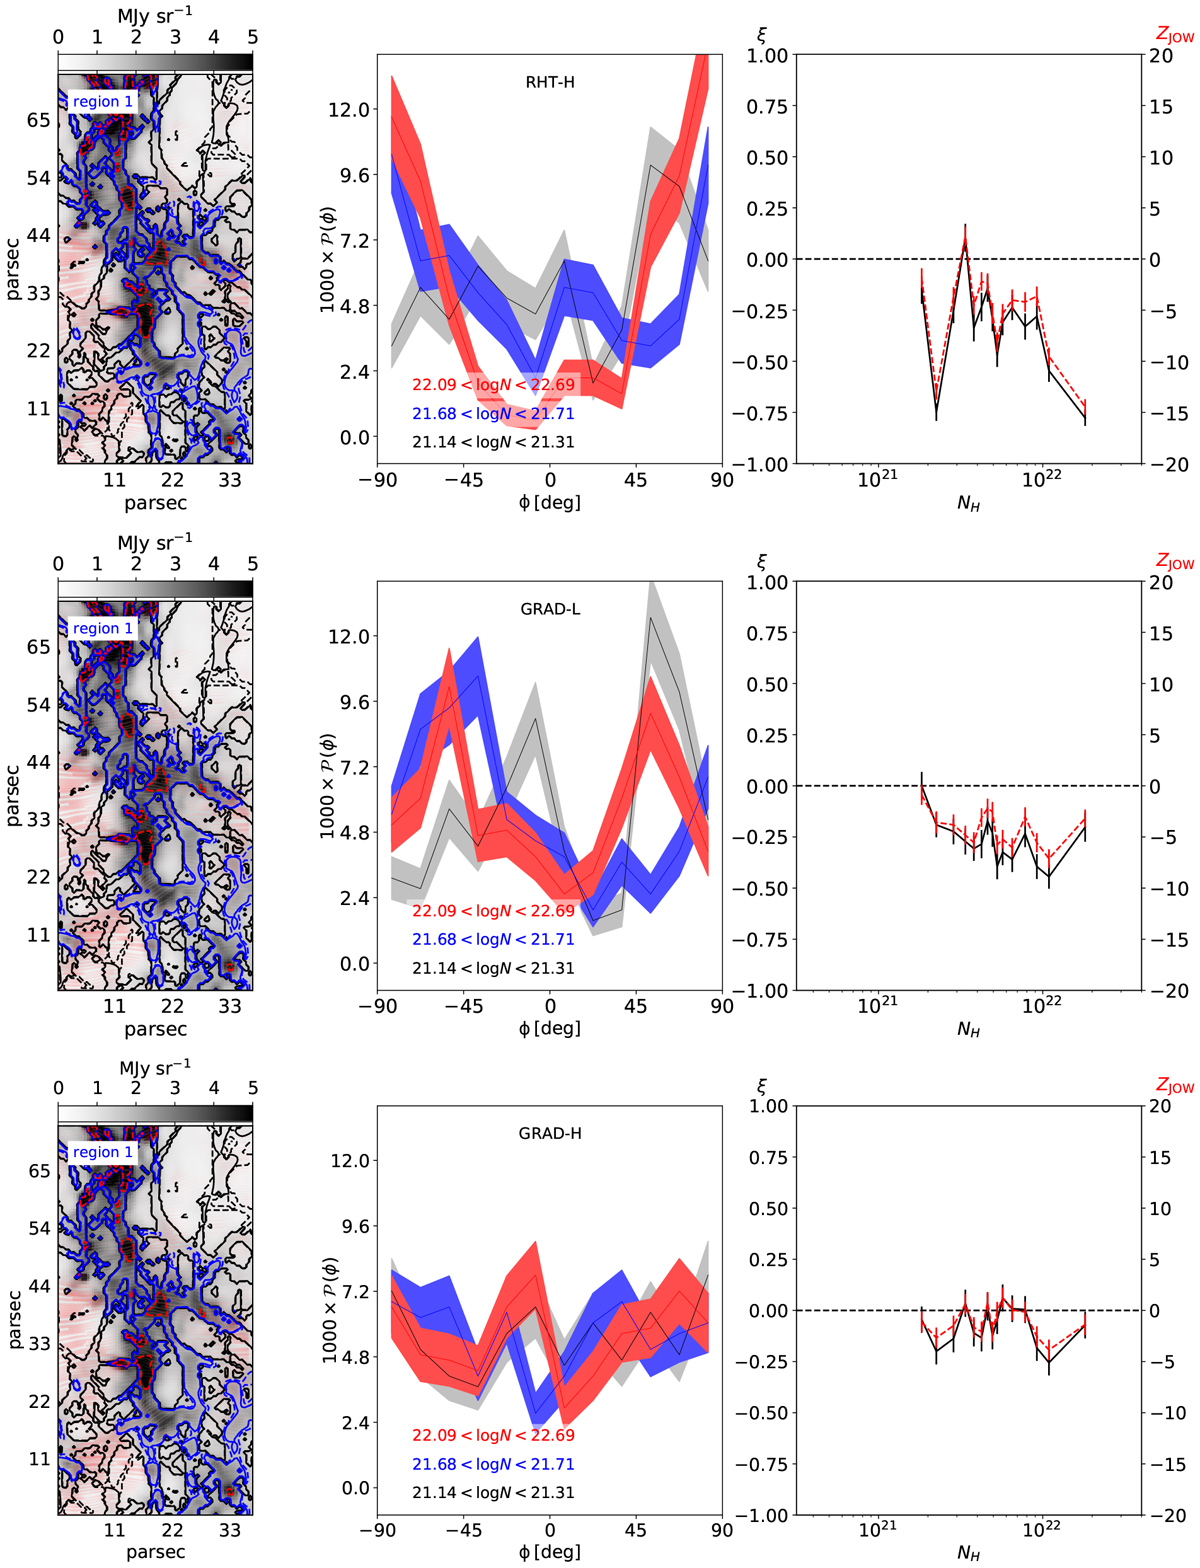
Analysis of Region 1 from Fig. 1, where the RHT and GRAD methods have both been applied to the structures selected by RHT (RHT-H case, top-left panel in Fig. 2). The columns show the surface brightness map overlaid with the red fingerprint pattern (left); the histograms of relative orientation (HROs – middle) between the magnetic field direction and the density structures; the ξ and ZJow parameters plotted as a function of column density, NH (right). For both parameters, a positive value indicates a preferred parallel orientation, a negative value a preferred perpendicular orientation and a value compatible with zero indicates that there is no preferred orientation. The areas between the solid and dashed contours on the maps (or inside them, if only one contour is present) highlight the regions corresponding to the column density bins shown in the HRO plots. Red and black identify the highest and lowest bins respectively, while blue indicates the intermediate bin between the two above. In the HRO plots, a ± 1σ error is represented by the width of the shaded areas. The top row shows the results for RHT-H, the middle row for GRAD-L and the bottom row for GRAD-H.
Current usage metrics show cumulative count of Article Views (full-text article views including HTML views, PDF and ePub downloads, according to the available data) and Abstracts Views on Vision4Press platform.
Data correspond to usage on the plateform after 2015. The current usage metrics is available 48-96 hours after online publication and is updated daily on week days.
Initial download of the metrics may take a while.