Fig. 4
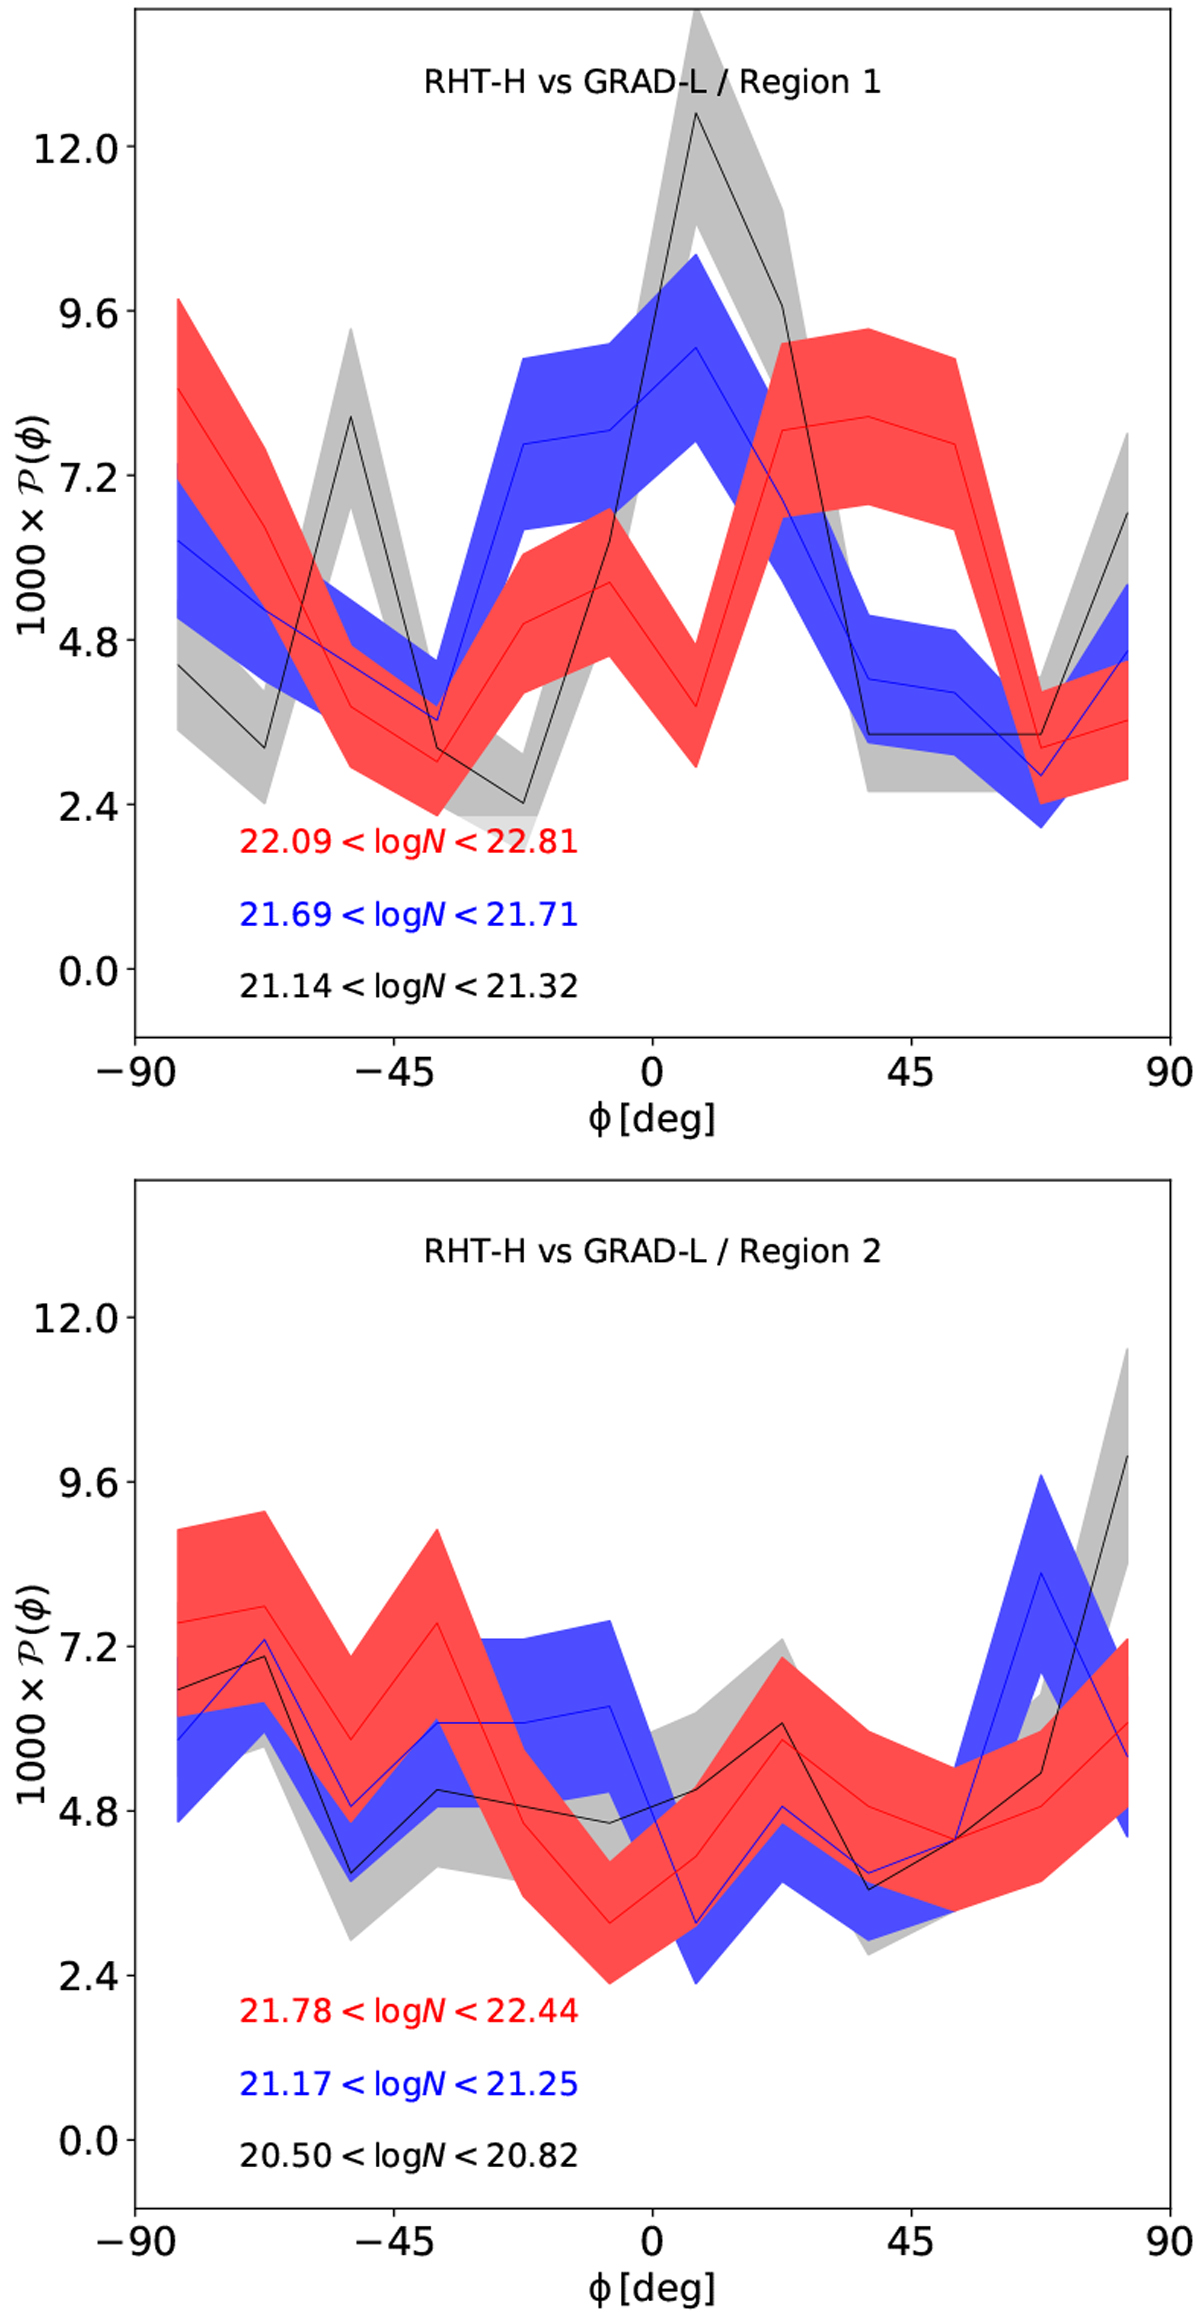
Histogram of relative orientation between the RHT angle expectation value (RHT-H case) and the direction angle derived from the GRAD method (GRAD-L case) for Region 1 (top) and Region 2 (bottom). The angles were calculated for the pixels that are common to both methods (yellow areas in Figs. 2 and 3). The curves show the HROs for three column-density bins: the highest and lowest ones (red and black, respectively) and the intermediate bin between these two (blue). A ± 1 σ error is represented by the width of the shaded areas.
Current usage metrics show cumulative count of Article Views (full-text article views including HTML views, PDF and ePub downloads, according to the available data) and Abstracts Views on Vision4Press platform.
Data correspond to usage on the plateform after 2015. The current usage metrics is available 48-96 hours after online publication and is updated daily on week days.
Initial download of the metrics may take a while.