Fig. 2
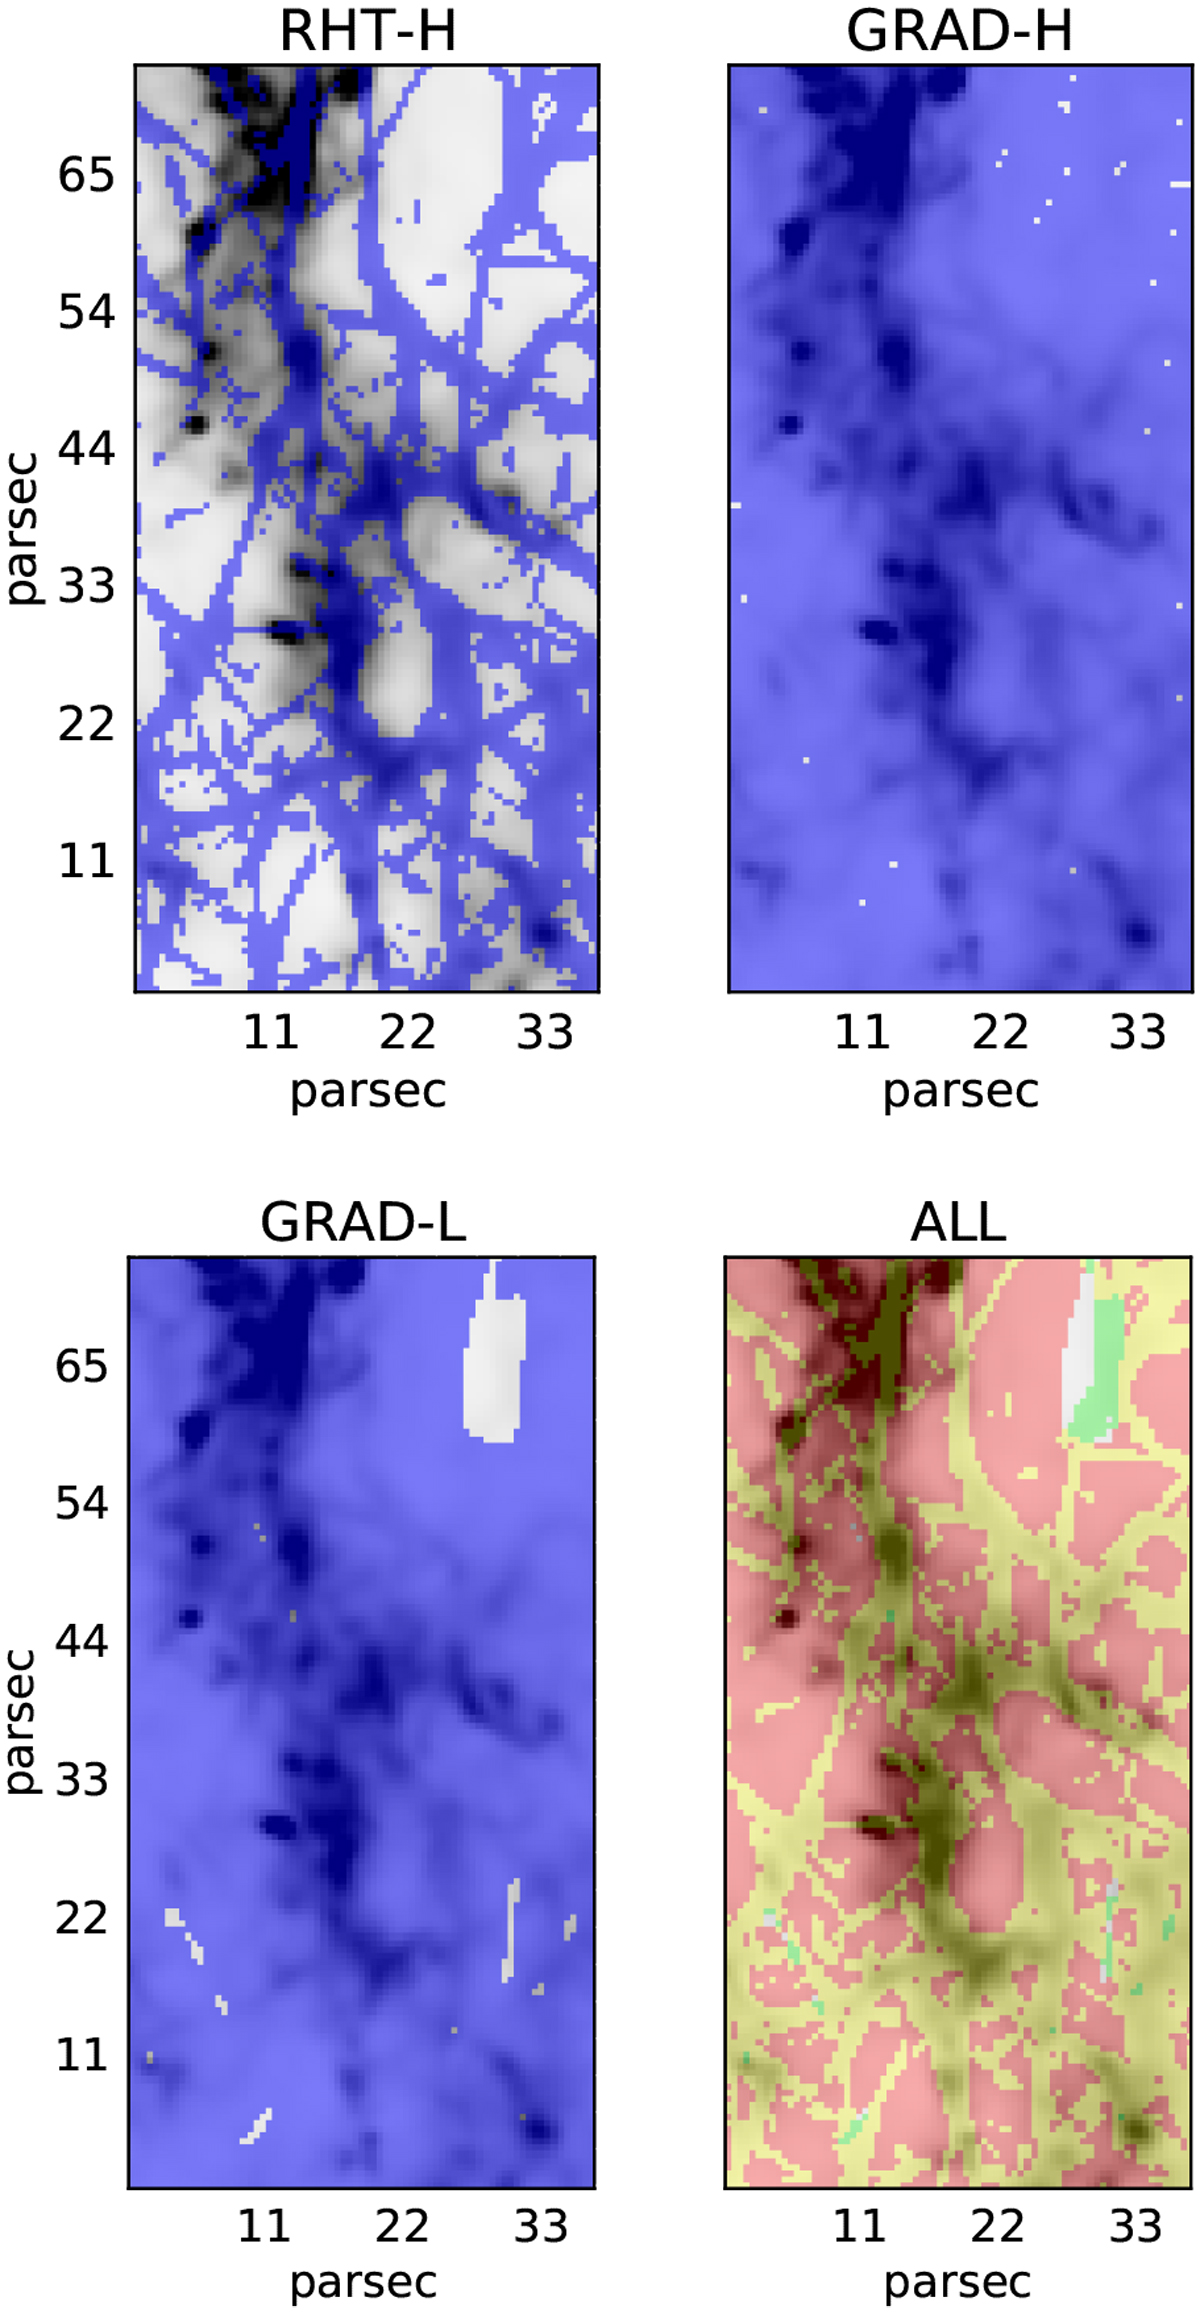
Comparison between the selected structures in Region 1, obtained from the RHT and GRAD methods. The recovered structures, indicated in blue, are overlaid on the brightness map (shades of gray). The RHT-H case (top-left) illustrates the results from RHT applied to surface brightness maps convolved using a Gaussian beam with FWHM = 1.2 pc. The GRAD-H case (top-right) results from GRAD using a convolution kernel of the same size, with the constraint that the module of the gradient must be greater than the average over a reference (smooth) region. The same constraint has been imposed in the GRAD-L case (bottom-left) with the difference that GRAD is applied using a Gaussian convolution kernel with FWHM = 7.2 pc. The bottom-right panel shows the superposition of the results for the RHT-H case (green) and the GRAD-L case (red). The yellow color indicates the regions in common between the two cases.
Current usage metrics show cumulative count of Article Views (full-text article views including HTML views, PDF and ePub downloads, according to the available data) and Abstracts Views on Vision4Press platform.
Data correspond to usage on the plateform after 2015. The current usage metrics is available 48-96 hours after online publication and is updated daily on week days.
Initial download of the metrics may take a while.