Fig. 10
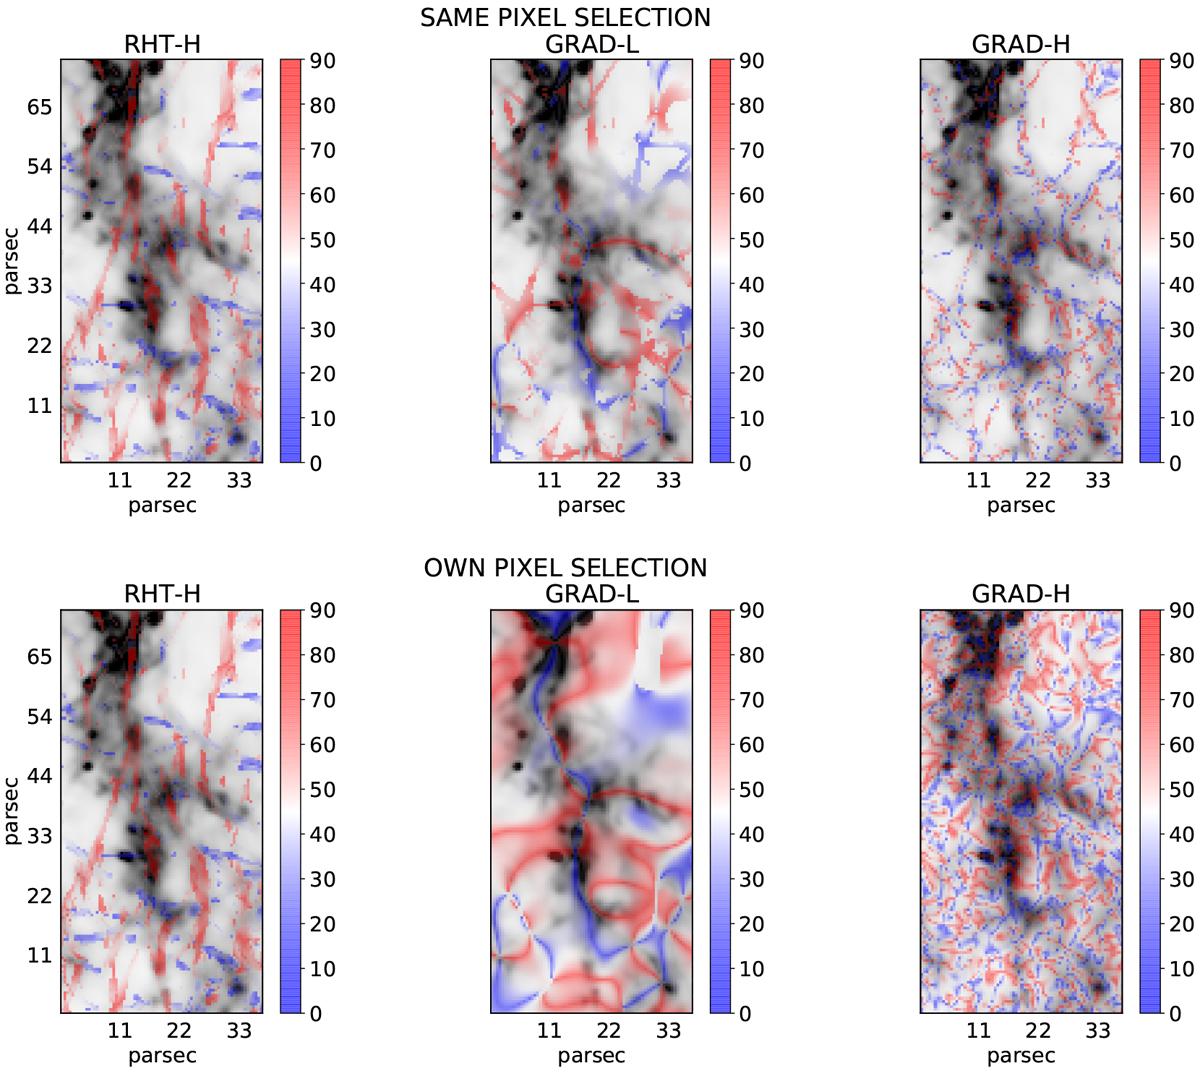
Relative orientation between the magnetic field and the density structures (blue-red) overlaid on the surface brightness map (shades of gray) in Region 1. The relative orientation goes from fully parallel (blue, 0°) to fully perpendicular (red, 90°). The top row shows the results from the analysis performed on the same pixel subsample for the RHT-H case (left), the GRAD-L case (middle) and the GRAD-H case (right). In the bottom row, each method is performed on its own native selection. Because the subsample chosen for the same-pixel analysis is the one from RHT (RHT-H case), the two panels on the left are the same.
Current usage metrics show cumulative count of Article Views (full-text article views including HTML views, PDF and ePub downloads, according to the available data) and Abstracts Views on Vision4Press platform.
Data correspond to usage on the plateform after 2015. The current usage metrics is available 48-96 hours after online publication and is updated daily on week days.
Initial download of the metrics may take a while.