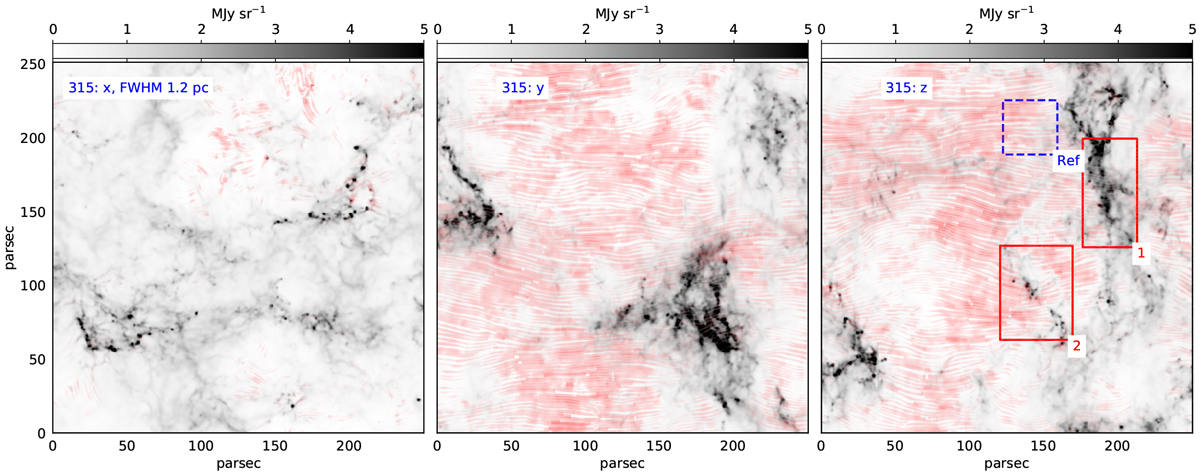
Fig. 1

Surface brightness maps at 353 GHz (850 μm – shades of gray) resulting from radiative transfer calculations performed on density structure maps from MHD simulations. Each frame shows the maps corresponding to one observing direction (x-left, y-center, z-right). The number “315” labeling each panel refers to a snapshot taken 11 Myr after self-gravity has been switched on in the simulation. The maps have been convolved using a Gaussian beam with FWHM = 2.5 pix = 1.22 pc. The “fingerprint” pattern shows the direction of the magnetic field derived from the Stokes parameter, and the intensity of the red color increases with the polarization fraction. The red boxes indicate the regions where individual analysis was performed while the blue dashed box identifies a low surface brightness area selected as a reference region (see Sect. 4.2 for details).
Current usage metrics show cumulative count of Article Views (full-text article views including HTML views, PDF and ePub downloads, according to the available data) and Abstracts Views on Vision4Press platform.
Data correspond to usage on the plateform after 2015. The current usage metrics is available 48-96 hours after online publication and is updated daily on week days.
Initial download of the metrics may take a while.


