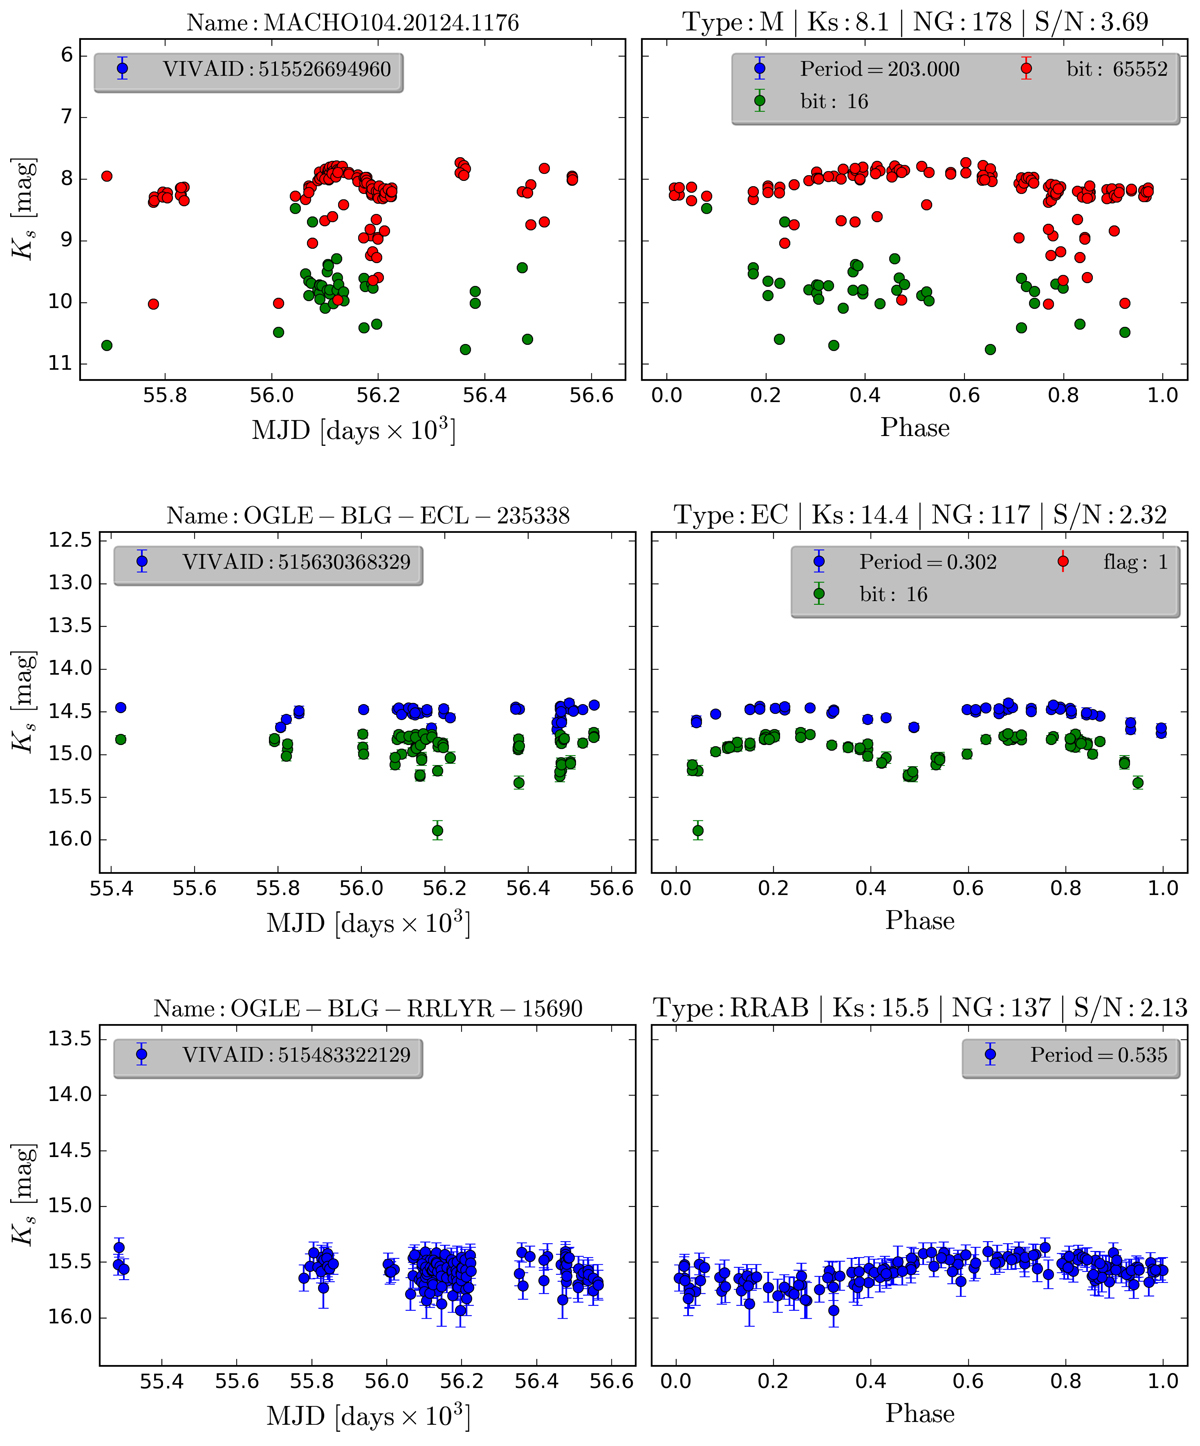
Fig. 9.

Time domain (on the left side) and phased light curves (on the right side) for examples of variable stars that are missing in the VIVA catalogue. The light curves display the VSX nameat the top and the VIVA ID inside the legend box, and the corresponding phase diagram shows the VSX type (Type), the VVV Ks magnitude, the number of good observations NG, and the S/N estimated with harmonic fits at the top, with the VSX period and the ppErrbits flags in the legend box inside the diagram. Blue points represent ppErrbits = 0 for good observations, and red and green stand for observations with ppErrbits ≠ 0.
Current usage metrics show cumulative count of Article Views (full-text article views including HTML views, PDF and ePub downloads, according to the available data) and Abstracts Views on Vision4Press platform.
Data correspond to usage on the plateform after 2015. The current usage metrics is available 48-96 hours after online publication and is updated daily on week days.
Initial download of the metrics may take a while.


