Fig. 8.
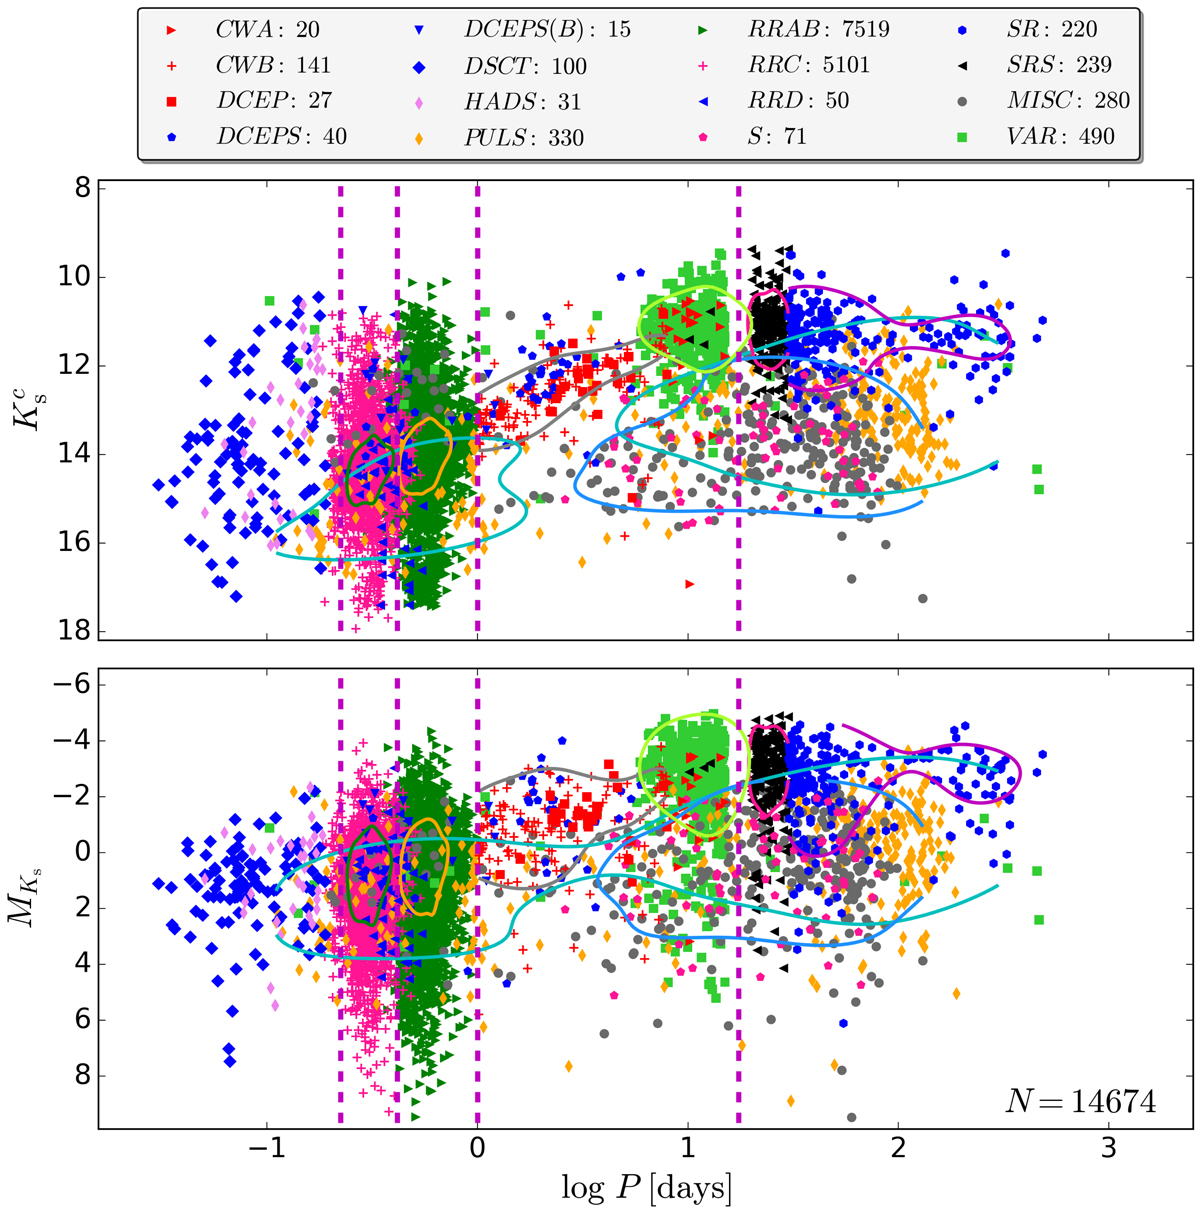
Diagram for the period as a function of the extinction-corrected Ks (top panel) and absolute MKs (bottom panel) magnitudes. The VSX variable types are highlighted. VSX types with fewer than ten stars were removed because they are not statistically relevant. The group called LPV (long-period variables) was removed because the measurement of its period in the VSX catalogue has low precision. Contours represent the 68th percentile (the contour colour differs from the point colour) of the types with more than 100 points and are represented as RRAB by the yellow contour, RRC in dark green, PULS in cyan, CWB in gray, MISC in blue, SR by the purple line, and VAR by the golden line. The vertical dashed purple lines represent the separation limits between DSCT and RRC (log P = −0.65), RRC and RRAB (log P = −0.38), above RRAB (log P = 0), and SR from short-period variables (log P = 1.24). The number N in the bottom panel is the total number of variables shown.
Current usage metrics show cumulative count of Article Views (full-text article views including HTML views, PDF and ePub downloads, according to the available data) and Abstracts Views on Vision4Press platform.
Data correspond to usage on the plateform after 2015. The current usage metrics is available 48-96 hours after online publication and is updated daily on week days.
Initial download of the metrics may take a while.