Fig. 1.
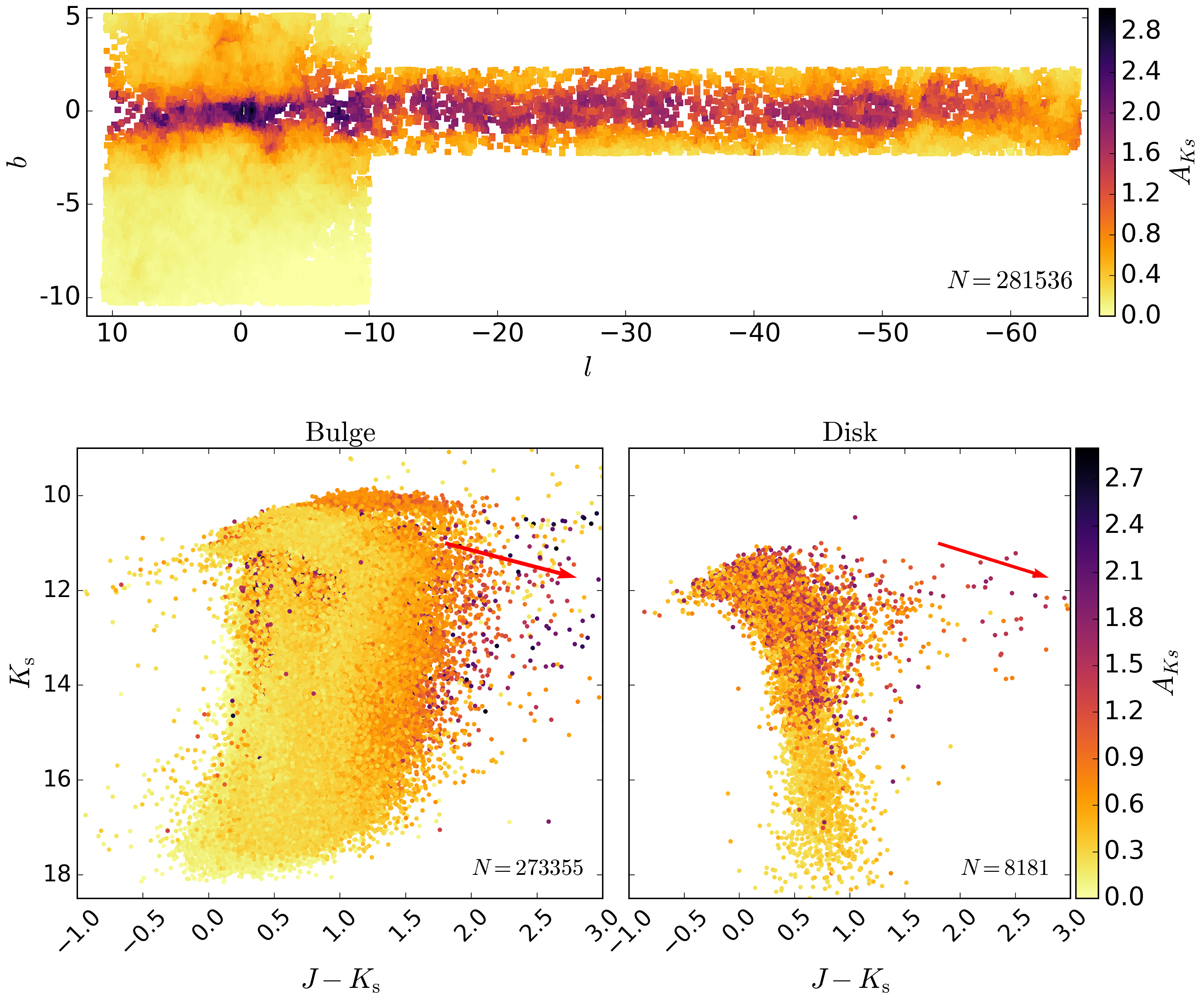
Top: distribution for all 281 536 stars in the match VVV+VSX. The data points are colour-coded by the total extinction AKs, integrated along the entire line of sight for each object. Values vary from AKs < 0.01 mag to AKs ∼ 3 mag near the Galactic centre. For nearby objects the total extinction as calculated by the VVV maps is certainly overestimated. Bottom: CMD diagram for the bulge (left) and disk (right) containing the variable stars of our sample colour-coded by the AKs parameter. The arrow shows the reddening vector for the diagram.
Current usage metrics show cumulative count of Article Views (full-text article views including HTML views, PDF and ePub downloads, according to the available data) and Abstracts Views on Vision4Press platform.
Data correspond to usage on the plateform after 2015. The current usage metrics is available 48-96 hours after online publication and is updated daily on week days.
Initial download of the metrics may take a while.