Fig. A.1.
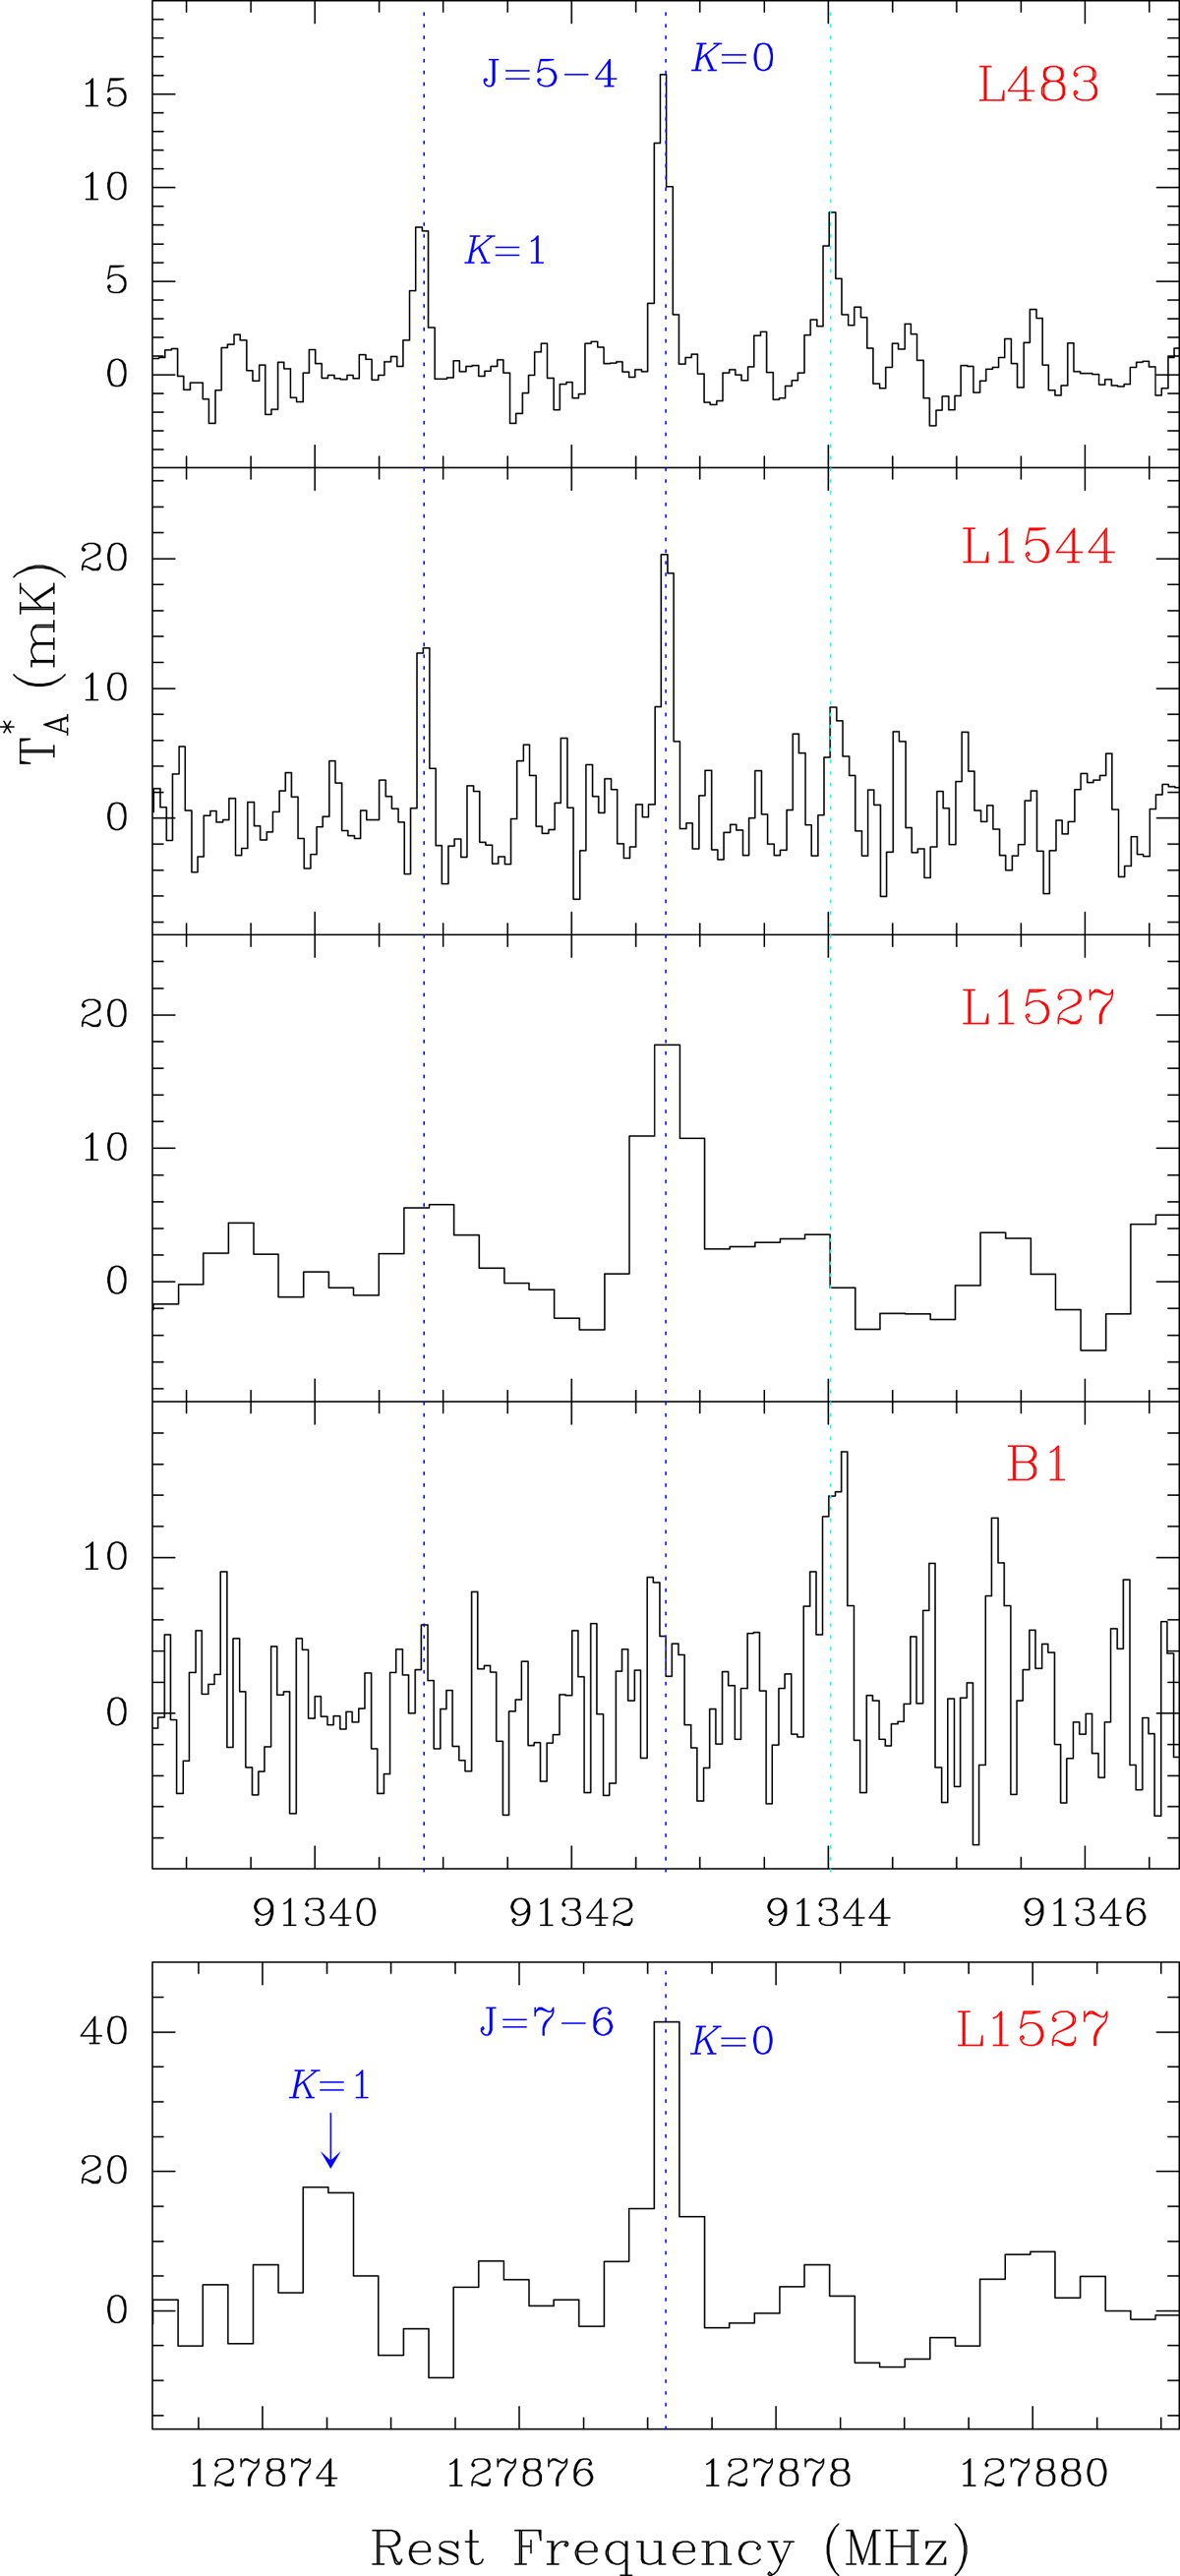
Observations of the J = 5−4 transition of CH3CO+ towards L483, L1544, L1527, and B1 (top panels); bottom panel: J = 7−6 line towards L1527. The abscissa corresponds to the rest frequency (in MHz) and the ordinate is the antenna temperature (in mK). The spectral resolution is 48.8 kHz for all sources except L1527, for which it is 198 kHz. The vertical dashed blue lines indicate the position of the K = 0 and K = 1 lines (detected in all sources except B1), and the cyan line corresponds to the U feature at 91 344 MHz (detected in all sources except L1527). The rest velocities of L1527 and L1544 were taken as vLSR = 5.9 km s−1 and 7.2 km s−1, respectively, based on Sakai et al. (2009) and Vastel et al. (2015), respectively.
Current usage metrics show cumulative count of Article Views (full-text article views including HTML views, PDF and ePub downloads, according to the available data) and Abstracts Views on Vision4Press platform.
Data correspond to usage on the plateform after 2015. The current usage metrics is available 48-96 hours after online publication and is updated daily on week days.
Initial download of the metrics may take a while.