Fig. 1.
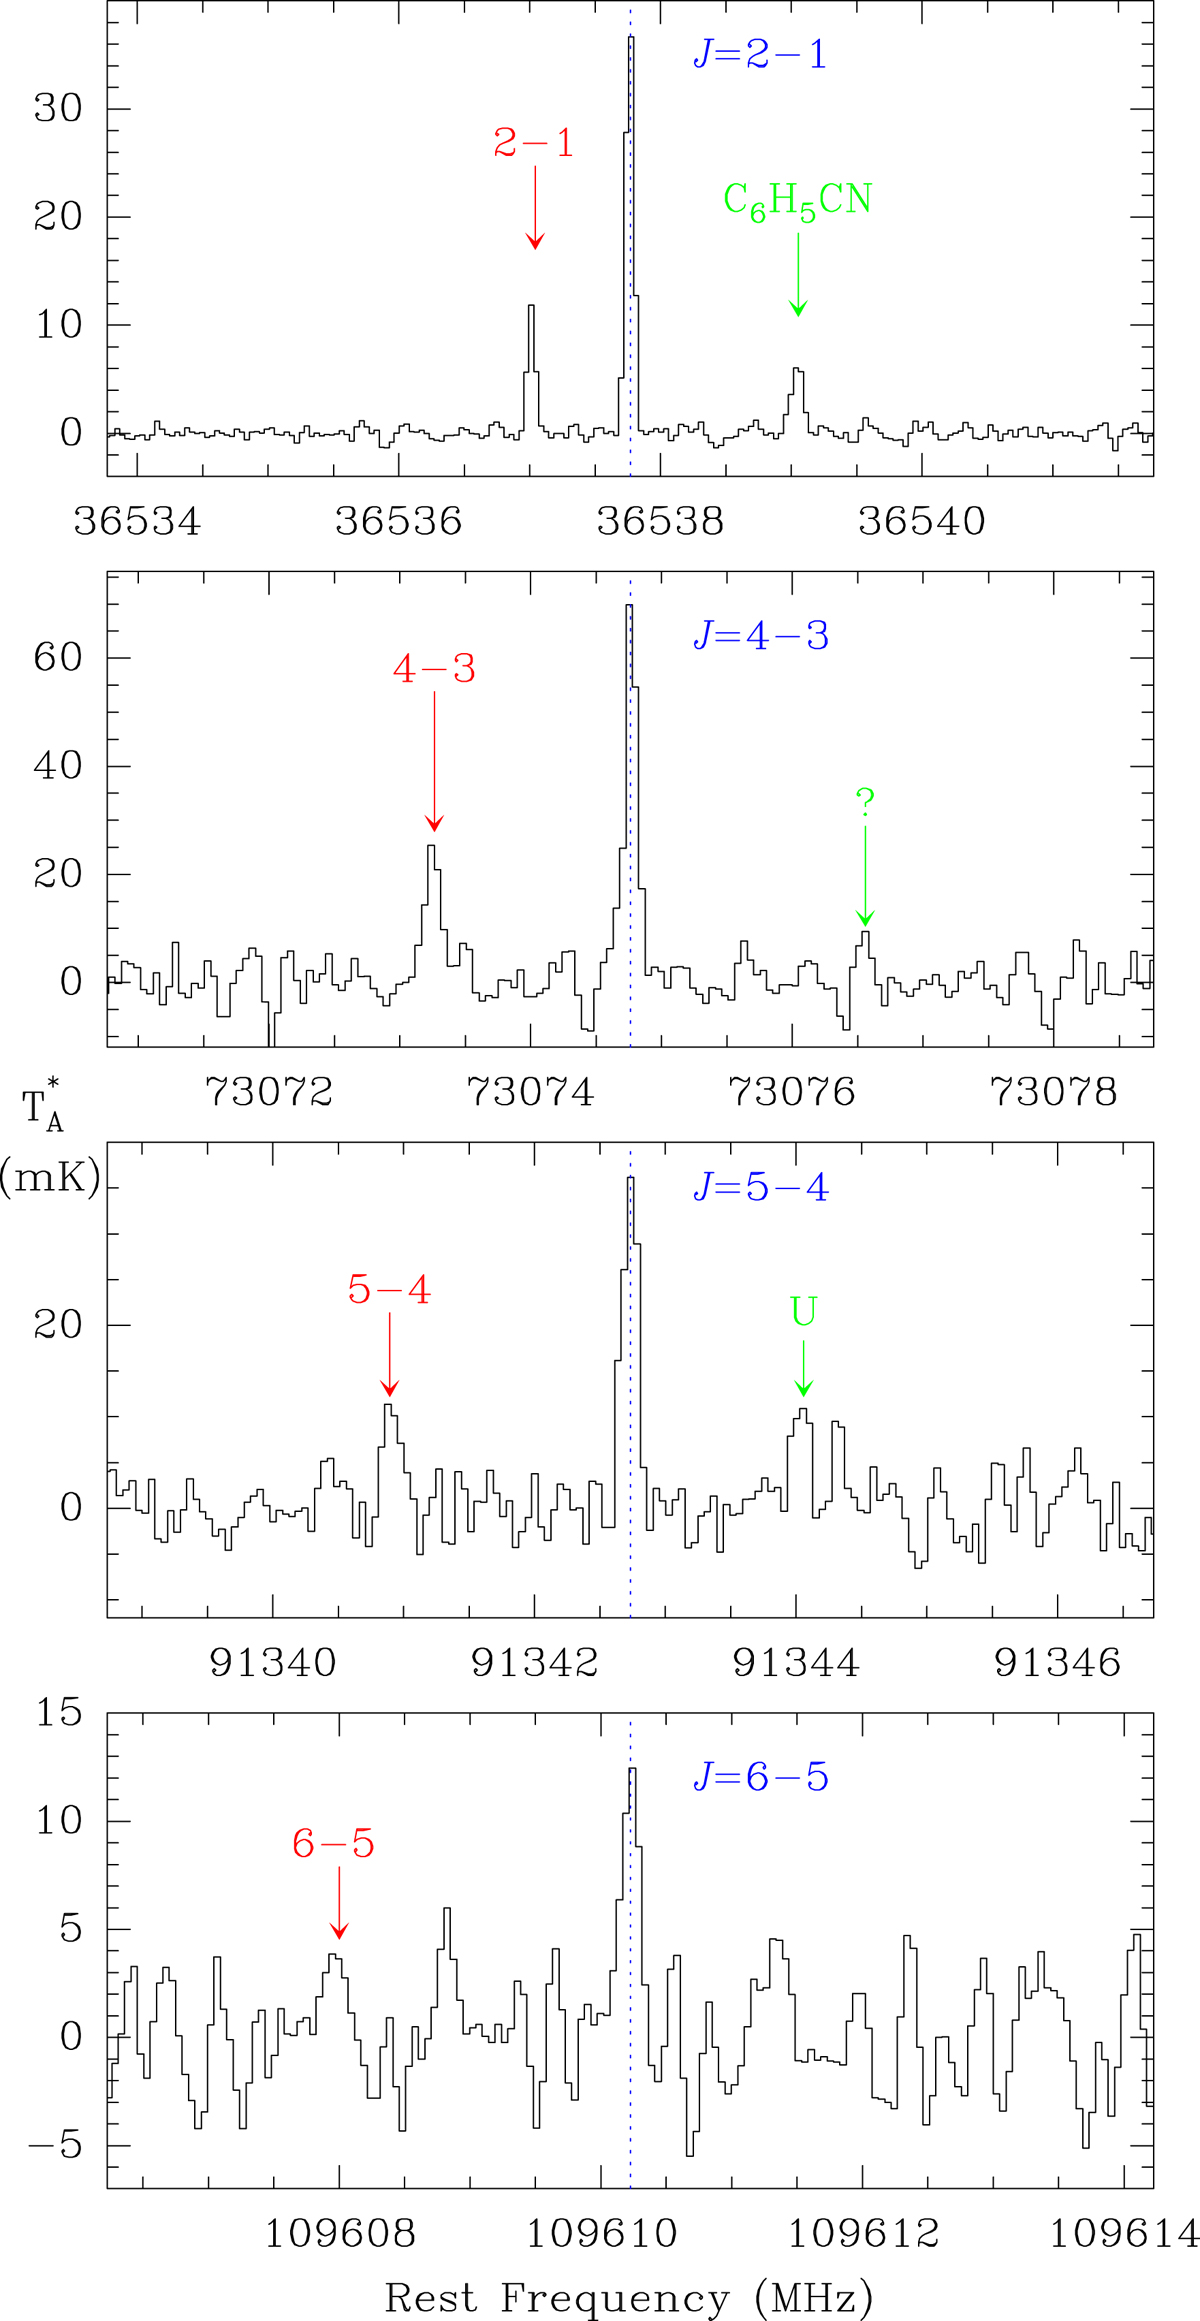
Observed lines of CH3CO+ towards TMC-1. The abscissa corresponds to rest frequencies (in MHz) assuming a local standard of rest velocity of 5.83 km s−1 (Cernicharo et al. 2020a,b). Frequencies and intensities for the observed lines are given in Table 1. The ordinate is the antenna temperature (in mK). Spectral resolution is 38.1 kHz below 50 GHz and 48.8 kHz above. The blue labels correspond to the series of lines we assign to the A species of CH3CO+, while the red ones correspond to those of the E species.
Current usage metrics show cumulative count of Article Views (full-text article views including HTML views, PDF and ePub downloads, according to the available data) and Abstracts Views on Vision4Press platform.
Data correspond to usage on the plateform after 2015. The current usage metrics is available 48-96 hours after online publication and is updated daily on week days.
Initial download of the metrics may take a while.