Fig. 8
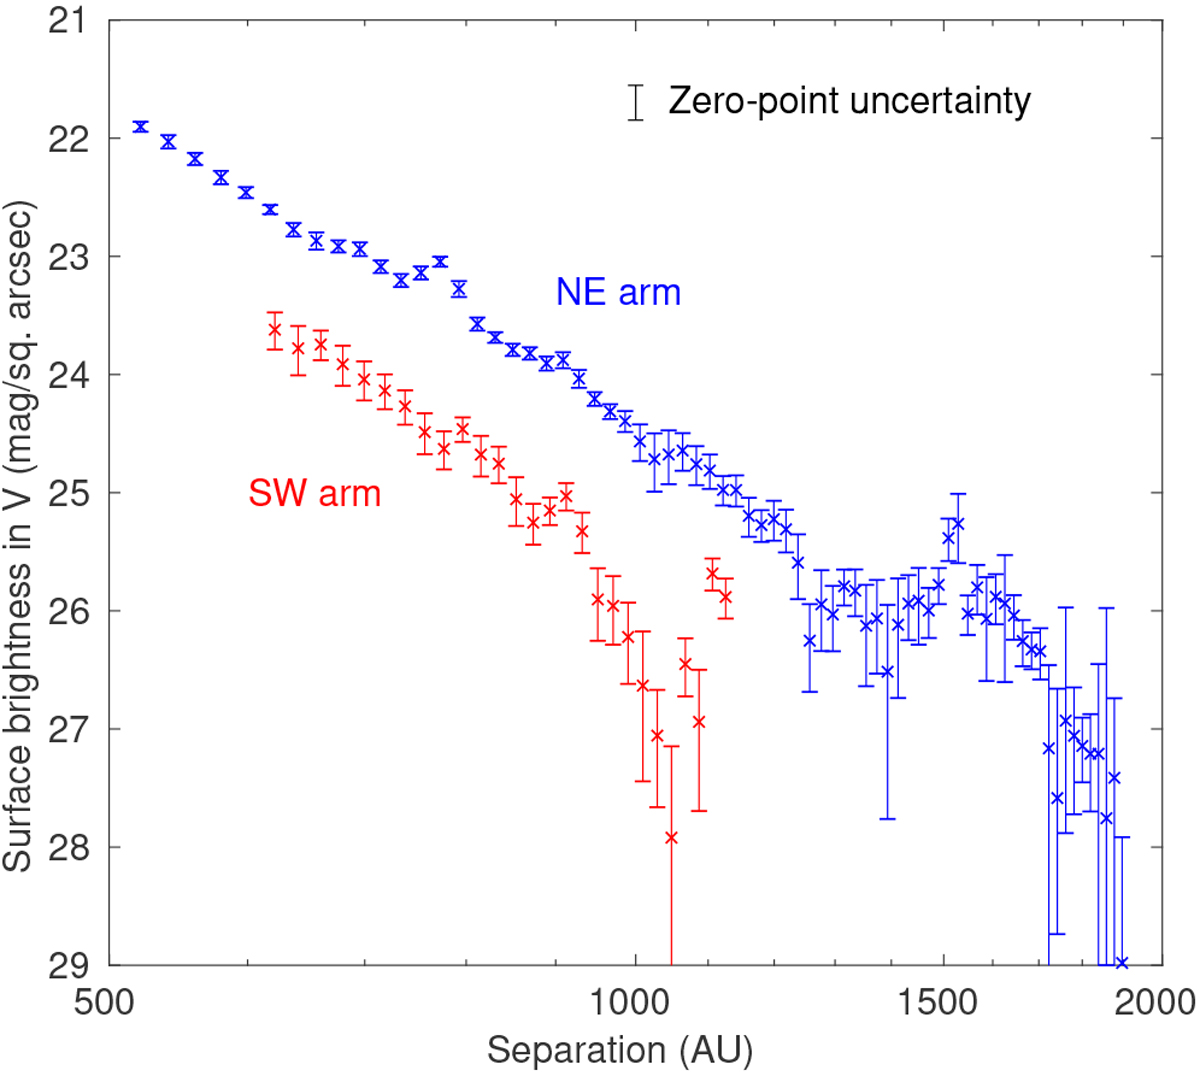
Surface brightness profile for the brighter NE arm (blue) and the fainter SW arm (red) of the disk. The bumps that deviate from the average trends are probably caused by background galaxies (see text). The SW arm measurements start at a larger projected separation than for the NE arm because of a small asymmetry in the placement of the star behind the central bar.
Current usage metrics show cumulative count of Article Views (full-text article views including HTML views, PDF and ePub downloads, according to the available data) and Abstracts Views on Vision4Press platform.
Data correspond to usage on the plateform after 2015. The current usage metrics is available 48-96 hours after online publication and is updated daily on week days.
Initial download of the metrics may take a while.