Fig. 4.
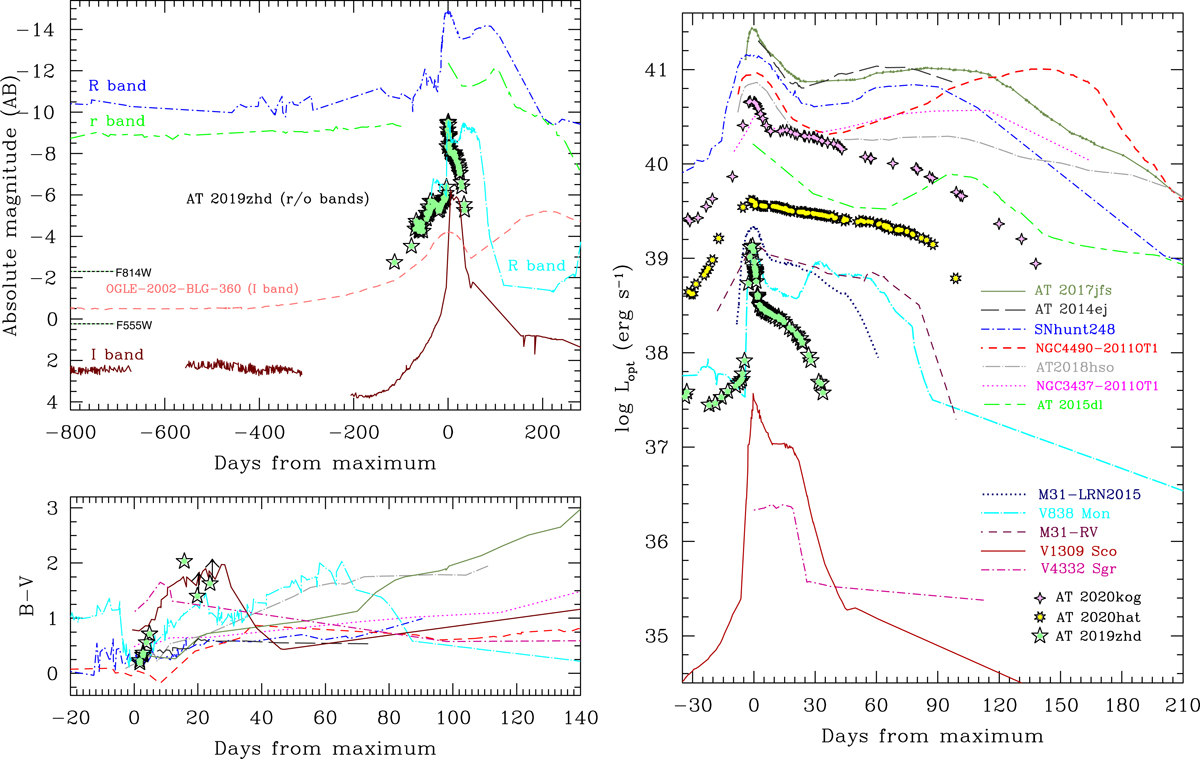
Top-left: comparison of absolute light curves for a sub-sample of LRNe, with emphasis on the pre-outburst phase. The data for the comparison objects, observed with Johnson-Cousins filters, are reported to the AB magnitude system by applying a shift of +0.21 mag for the R-band and +0.45 mag for the I-band observations, as indicated in Blanton & Roweis (2007). The short dotted lines to the left indicate the absolute magnitudes of the quiescent progenitor of AT 2019zhd (HST-F555W and F814 bands, in the AB magnitude system; see Sect. 6). Bottom-left: B − V colour curves of a few LRNe during the outburst. Right: pseudo-bolometric light curve of AT 2019zhd, along with those of a wide sample of LRNe. We used the same interstellar extinction and distance values as in Pastorello et al. (2019a, see their Table 3). The data of AT 2018hso and AT 2014ej are from Cai et al. (2019) and Stritzinger et al. (2020), respectively, while those of AT 2020kog and AT 2020hat are from Pastorello et al. (2021). In all panels, the curves for the different objects are identified with the symbols labelled in the right panel.
Current usage metrics show cumulative count of Article Views (full-text article views including HTML views, PDF and ePub downloads, according to the available data) and Abstracts Views on Vision4Press platform.
Data correspond to usage on the plateform after 2015. The current usage metrics is available 48-96 hours after online publication and is updated daily on week days.
Initial download of the metrics may take a while.