Free Access
Fig. 2.
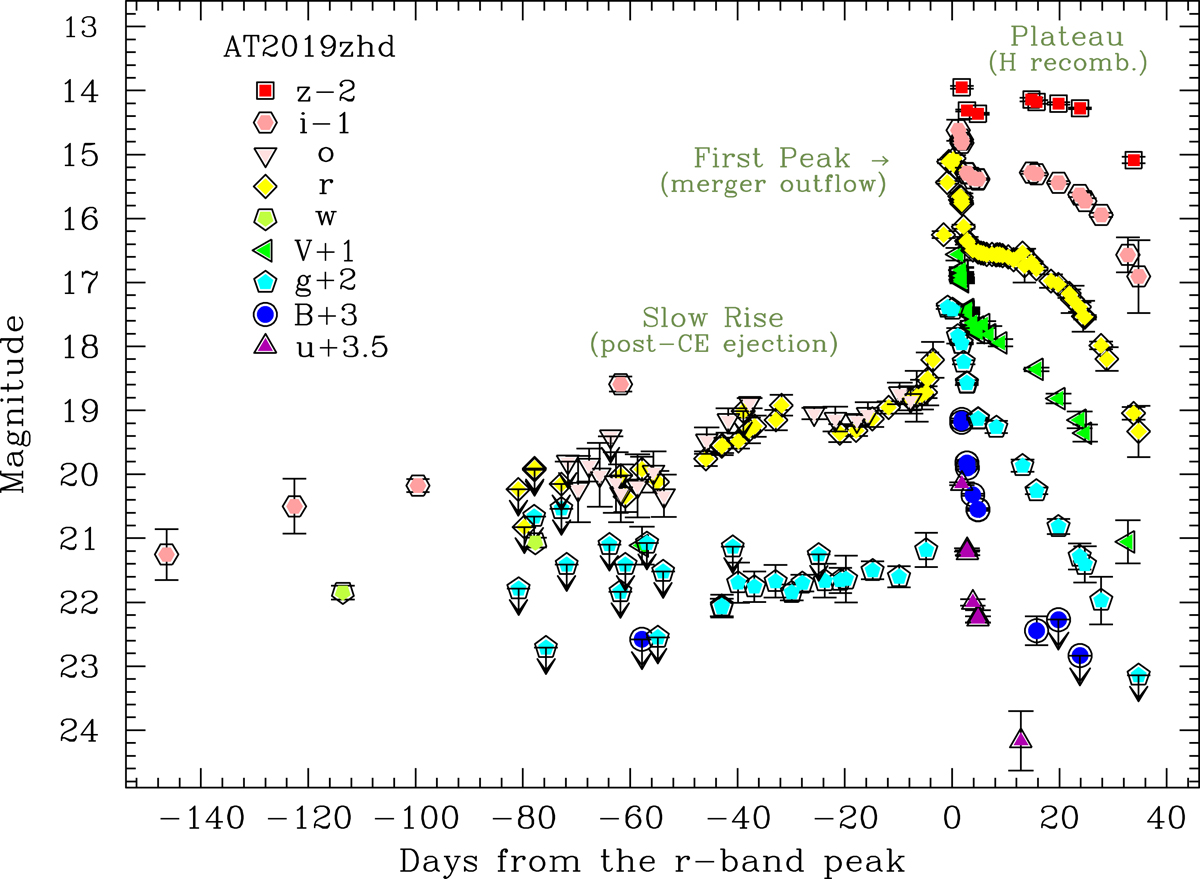
Long-term light curve of AT 2019zhd, which includes both pre-outburst photometry and the LRN outburst. The phases are computed from the r-band maximum (MJD = 58892.0 ± 0.5). Only significant detection limits are shown in the figure.
Current usage metrics show cumulative count of Article Views (full-text article views including HTML views, PDF and ePub downloads, according to the available data) and Abstracts Views on Vision4Press platform.
Data correspond to usage on the plateform after 2015. The current usage metrics is available 48-96 hours after online publication and is updated daily on week days.
Initial download of the metrics may take a while.