Fig. 10.
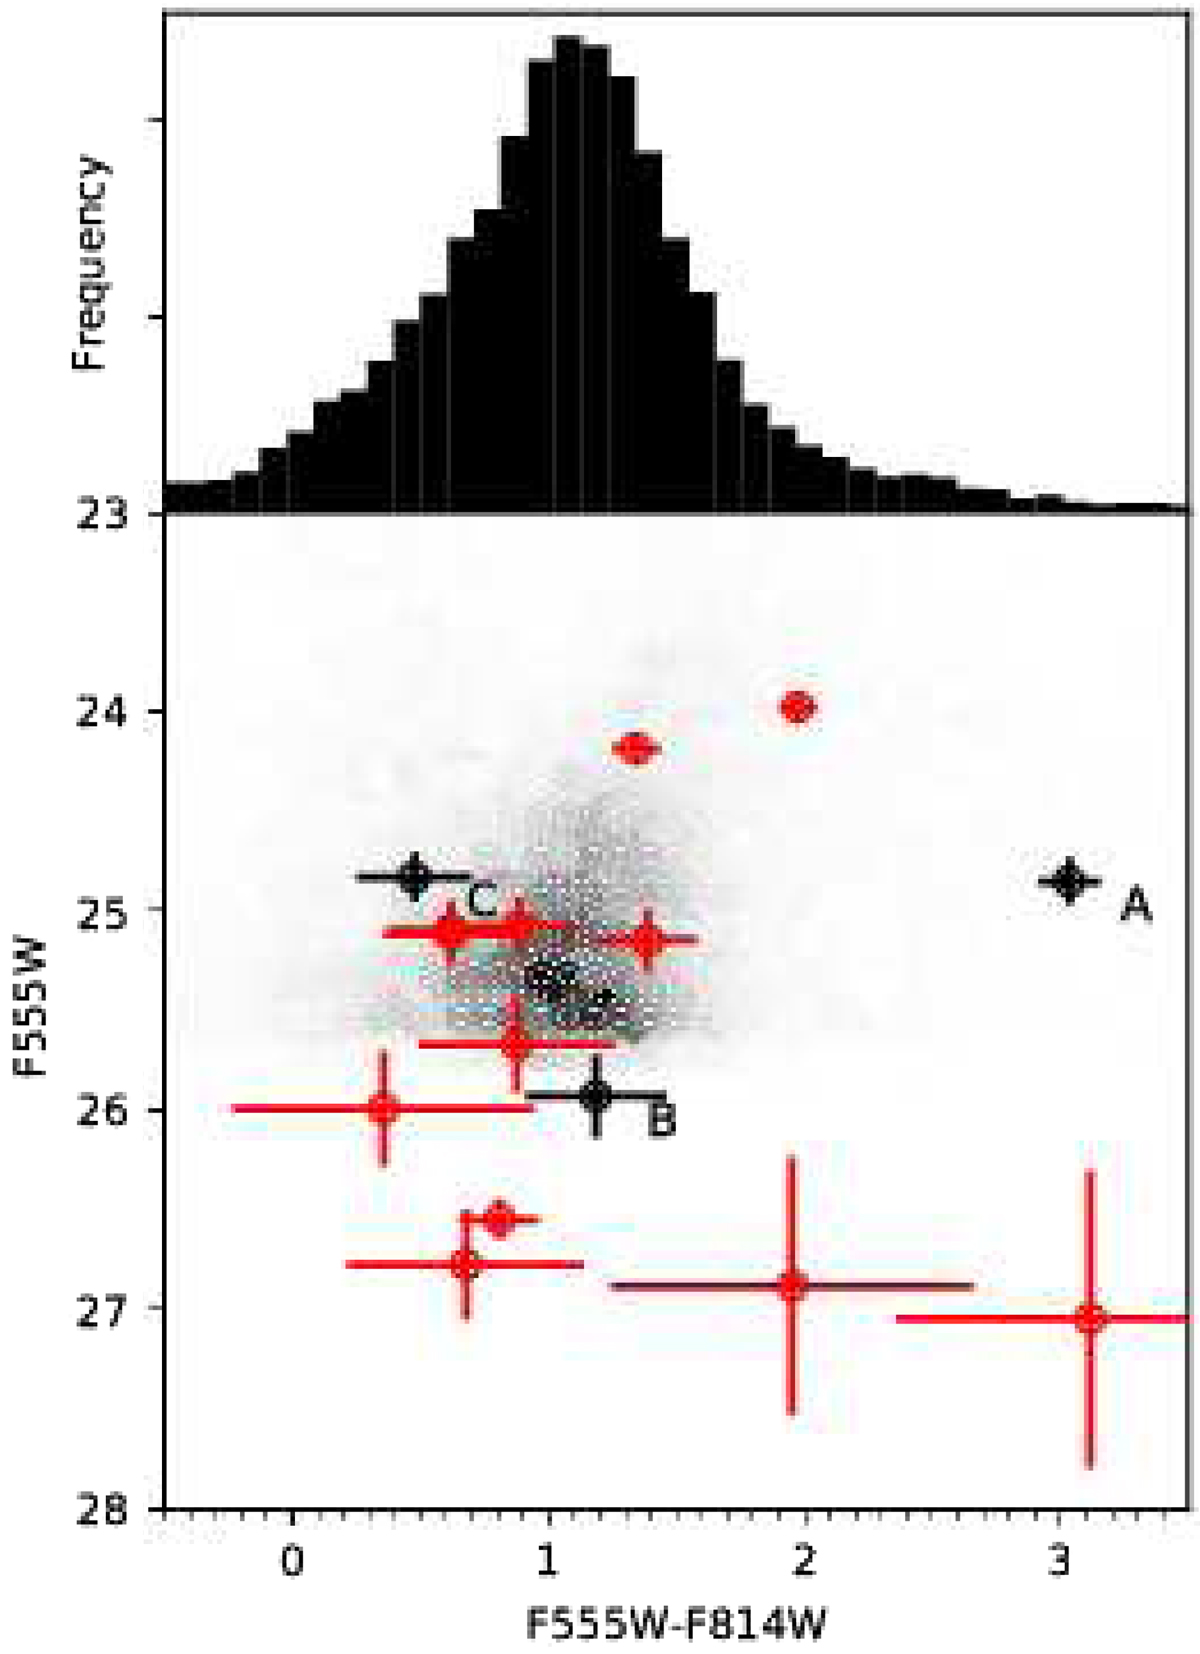
Top: histogram of the F555W − F814W colour for all sources on the WF4 chip, showing how Source A is clearly redder than the vast majority of these. Bottom: colour-magnitude diagram of the sources found by DOLPHOT in the vicinity of AT 2019zhd. The grey density plot shows all sources detected at > 5σ on the WF4 chip, while the red points show sources within the 2″ × 2″ region shown in Fig. 9. Sources A, B and C as discussed in the text are labelled.
Current usage metrics show cumulative count of Article Views (full-text article views including HTML views, PDF and ePub downloads, according to the available data) and Abstracts Views on Vision4Press platform.
Data correspond to usage on the plateform after 2015. The current usage metrics is available 48-96 hours after online publication and is updated daily on week days.
Initial download of the metrics may take a while.