Fig. B.1
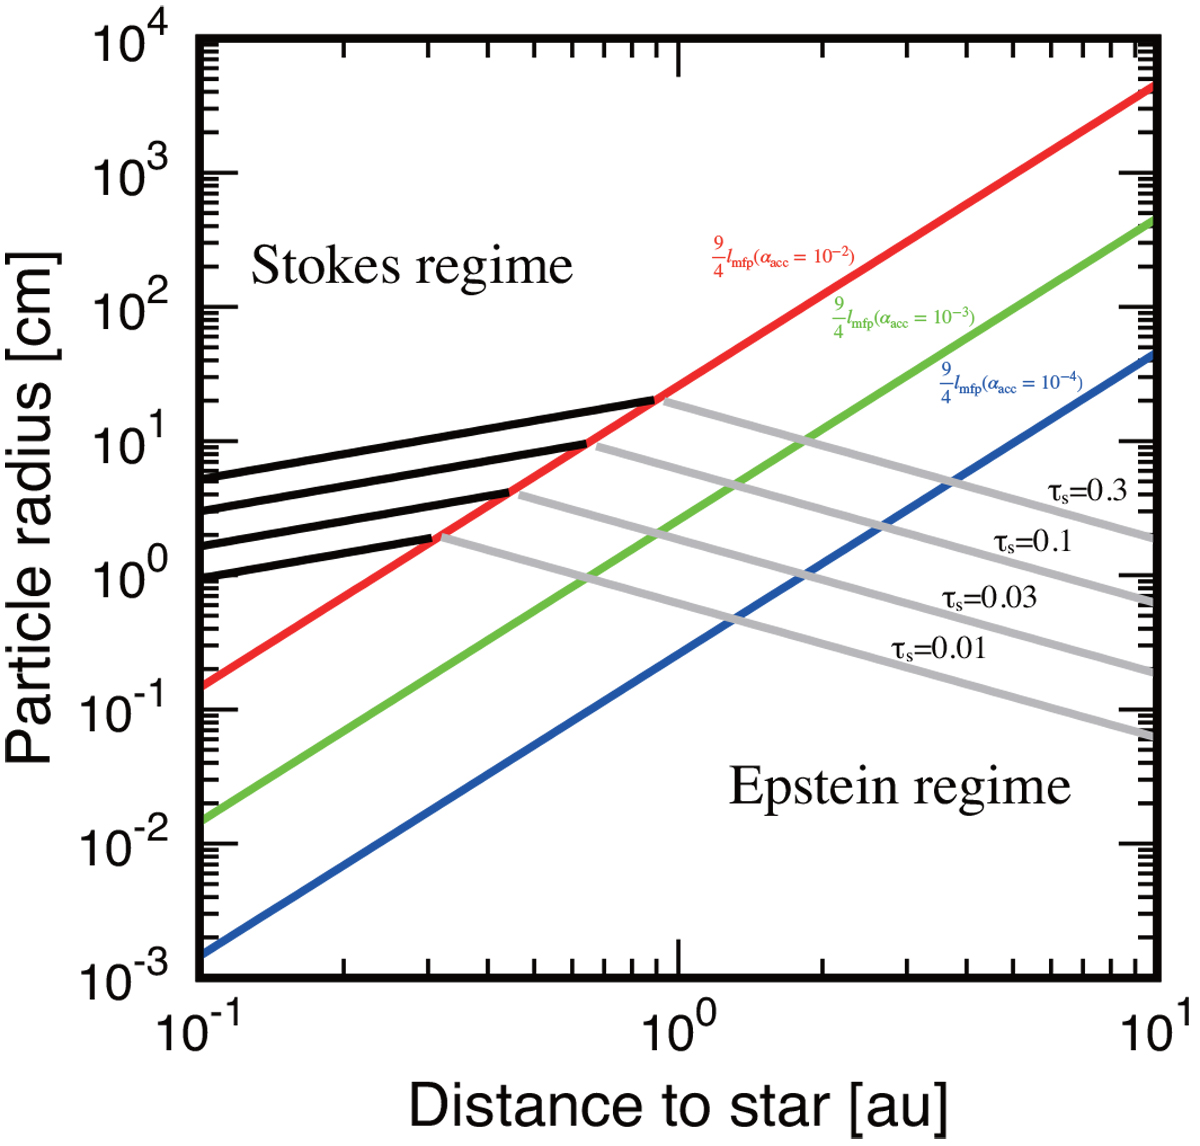
Particle size as a function of distance to the star. The red, green, and blue lines represent ![]() for αacc = 10−2, 10−3, and 10−4, respectively (Eq. (B.3)). The Stokes regime is where
for αacc = 10−2, 10−3, and 10−4, respectively (Eq. (B.3)). The Stokes regime is where ![]() , while the Epstein regime is where
, while the Epstein regime is where ![]() . Four black and gray lines represent particle size whose τs = 0.3, 0.1, 0.03, and 0.01 in the Stokesregime and the Epstein regime with αacc = 10−2, respectively. Here, Ṁg = 10−8M⊙ yr−1 and
. Four black and gray lines represent particle size whose τs = 0.3, 0.1, 0.03, and 0.01 in the Stokesregime and the Epstein regime with αacc = 10−2, respectively. Here, Ṁg = 10−8M⊙ yr−1 and ![]() are used.
are used.
Current usage metrics show cumulative count of Article Views (full-text article views including HTML views, PDF and ePub downloads, according to the available data) and Abstracts Views on Vision4Press platform.
Data correspond to usage on the plateform after 2015. The current usage metrics is available 48-96 hours after online publication and is updated daily on week days.
Initial download of the metrics may take a while.