Fig. 5
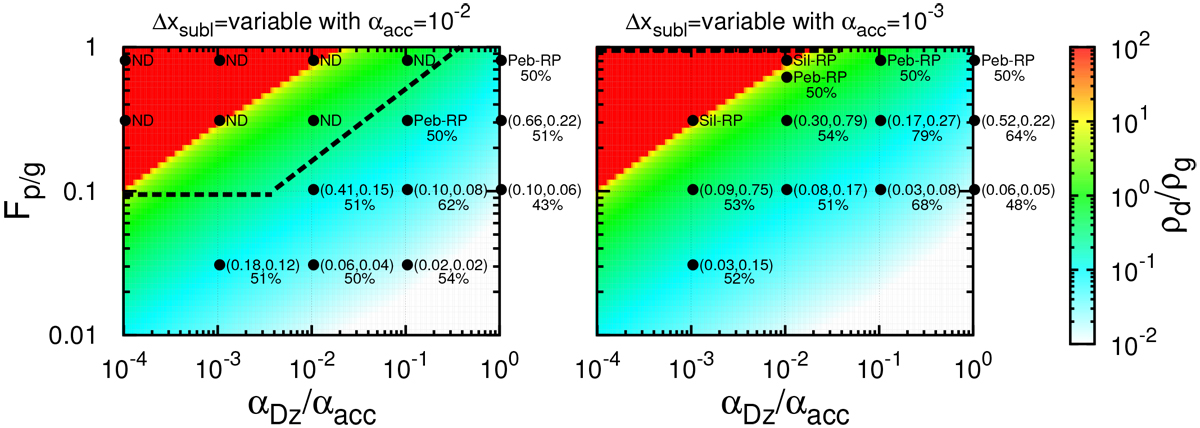
Zones of pile-up of pebbles and/or silicate dust around the snow line as a function of Fp/g and αDz(= αDr)∕αacc (case of a variable Δxsubl; Eq. (74) in Sect. 3.4). The numbers in the parenthesis represent the maximum ρp ∕ρg (left) and ρd∕ρg (right) obtained from our full 1D simulations, respectively. The numbers below the parenthesis represent the rock fraction in the surface density of pebbles at the maximum ρp ∕ρg (when a runaway pile-up of silicate dust occurs, the fraction is not shown because the system would gravitationally collapse to form 100% rocky planetesimals). The runaway pile-up of pebbles (labeled as “Peb-RP”) or that of silicate dust (labeled as “Sil-RP”) occurs around the snow line, depending on the combinations of Fp/g and αDz(= αDr). The color contour shows an analytical prediction of the maximum ρd∕ρg just inside the snow line obtained from Paper I. The black dashed line indicates analytically derived critical Fp/g above whichthe “no-drift (ND)” takes place (labeled by “ND” for the results of 1D simulations in the panels) at the outer boundary (r = 5 au and τs,p = 0.125; Sect. 4.2). Drift-BKR and Diff-BKR onto the motions of pebbles and silicate dust are included with K = 1. Left and right panels: cases of αacc = 10−2 and αacc = 10−3, respectively. In the case of αacc = 10−2, the runaway pile-up of silicate dust is inhibited because the required parameter regime is overlapped by the “no-drift” region (i.e., pebbles do not reach the snow line). In the case of αacc = 10−3, the runaway pile-ups of both pebbles and silicate dust occur.
Current usage metrics show cumulative count of Article Views (full-text article views including HTML views, PDF and ePub downloads, according to the available data) and Abstracts Views on Vision4Press platform.
Data correspond to usage on the plateform after 2015. The current usage metrics is available 48-96 hours after online publication and is updated daily on week days.
Initial download of the metrics may take a while.